
Viewpoint
- Are the ‘good times’ back?
- Quick take on CSL’s valuation
- Can the market chart the inflation path?
One of the more interesting news stories recently has been the Chinese weather balloons that apparently blew off their planned courses by unexpected winds. The balloons are said to have had limited steering capability and thus were at the mercy of the elements after being sent off by their owners. This story is a suitable allegory for global markets over recent months. Markets were exceptionally strong during the fourth quarter and into January and seemed to acquire a life of their own as market participants persuaded themselves that inflation was under control and central bank tightening would soon reach the point of maximum pain, thus delivering a tailwind to the market in coming years. Just like the weather balloons, one of which ended up near strategic US military sites, the equivalent market balloon, while initially appearing to be at the mercy of unknown forces, has ended up just where one might expect – a rally in the price of longer-dated growth stocks and tech names!
January in particular has seen a strong move in the growth segment of the market on the back of a 50 basis point decline in 10-year yields in Australia over the month and 35 basis points in the US. The NASDAQ increased ~11% during January alone. Cathie Wood’s ARK Innovation ETF rose ~28% during January (albeit after dropping 67% over 2022), while Tesla added ~40%. Investors in general remain committed to this segment of the market and continue to look for any indication that a return of the ‘good times’ of the past decade are waiting around the corner (or should we say, past that next cloud).
We see reasons to doubt the ‘good times’ will return any time soon.
- Valuation is key. CSL is the largest capitalisation industrial stock in our market, comprising over 6% of the benchmark and a champion of the growth stock trade of the past decade, following a huge re-rating. CSL trades on a forward, consensus, price-earnings (PE) multiple of ~35 times and the chart highlights that this is near the top decile of PEs the stock has enjoyed over the past 20 years. Any expectation that CSL might enjoy a sustainable expansion in its PE multiple from this level and drive the next level of outperformance would seem to fly both in the face of history, as well as international market experience. While CSL is the largest industrial stock, it is by no means the only industrial trading on extended earnings multiples. Despite significant underperformance by this group of stocks over the past two years, their average PE multiple remained approximately one standard deviation expensive relative to historic averages, at a time when significantly higher interest rates should be compressing valuations.
CSL – P/E (NTM)
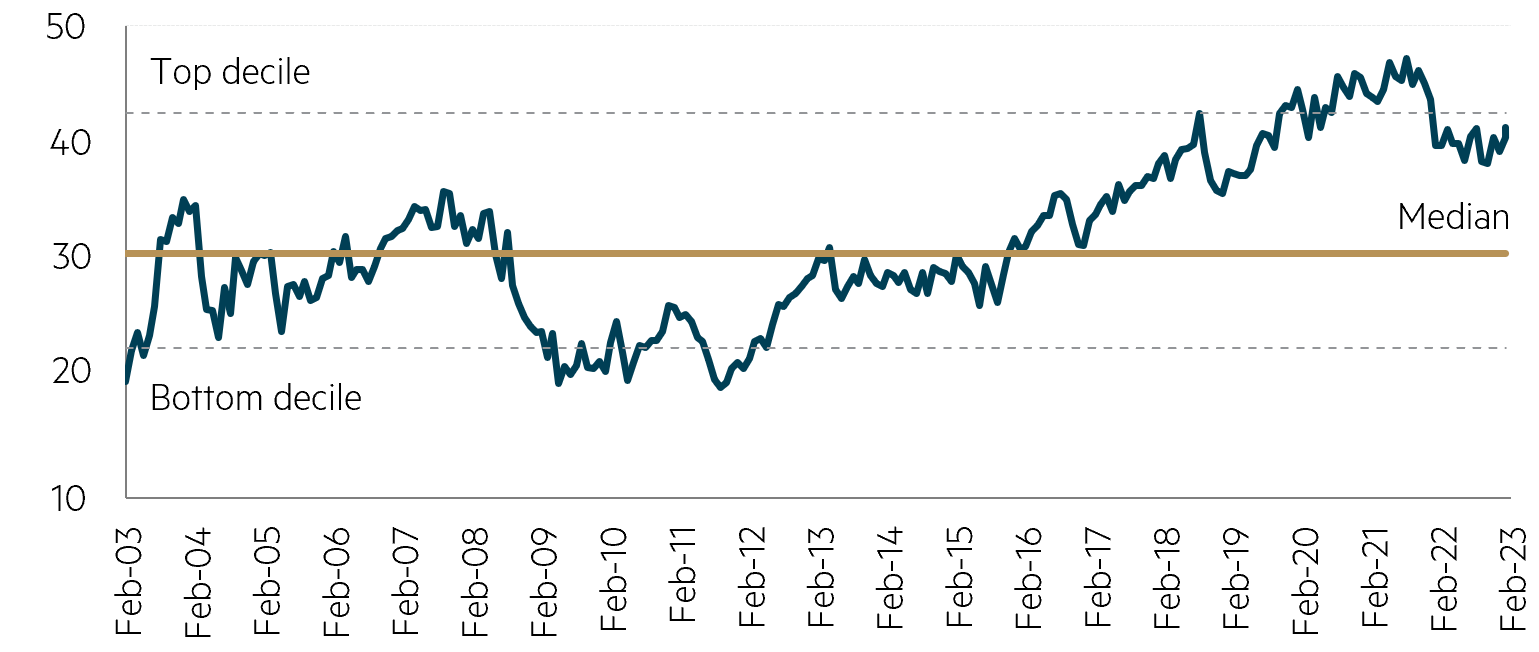
Source: FactSet, data to January 2023.
- Inflation poses a challenge. Investors globally are watching every data point wanting to call victory over inflation. While we may have seen the worst, with energy prices currently much lower, services inflation is picking up and employment levels remain strong for now. Given how surprised central banks (and investors) were by the breakout of inflation, we place little confidence in the ability of the market to correctly call the path back to target levels. We expect inflation will remain ‘sticky’ and the commentary from the Reserve Bank of Australia that accompanied the early February 25 basis point rate increase was a sobering reminder.
- Earnings pressure looms. Profit forecasts have remained resilient in the face of higher interest rates and we think they assume unduly optimistic outcomes. Some commentary suggests markets are happy to look through the cycle to the ‘other side’ (some are even saying there won’t even be a cycle of note) and that stocks are beginning to look to better times. In our view, expectations are overly optimistic and bringing inflation under control will take its toll on earnings. CSL is a good example of an optimistic earnings picture (albeit not overly impacted by inflation). Consensus earnings numbers forecast USD EPS growth of ~20% p.a. for the FY22-25 period, (off a base well in excess of USD $2 billion).1 Over the past decade, CSL’s best three-year compound growth rate has been 17% and the average rolling three-year rate only~11%. A mix of high earnings multiples and optimistic earnings forecasts will in our view continue to pressure the industrial favourites.
Parting thought
Notwithstanding recent market strength which has seen the Australian market back to within touching distance of all-time highs, and in particular the recovery in the prices of some of the hardest hit tech and growth stocks, we remain firmly of the view that valuation ultimately determines the direction of share prices. The leading industrial stocks continue to look stretched from a valuation perspective and we do not believe the relative strength that we saw in these names in January will be sustained. This has implications for the level of the market, but particularly for stock selection where the better valued names are favoured.
1 Source: FactSet.
Disclaimer
This information was prepared and issued by Maple-Brown Abbott Ltd ABN 73 001 208 564, Australian Financial Service Licence No. 237296 (“MBA”). This information must not be reproduced or transmitted in any form without the prior written consent of MBA. This information does not constitute investment advice or an investment recommendation of any kind and should not be relied upon as such. This information is general information only and it does not have regard to any person’s investment objectives, financial situation or needs. Before making any investment decision, you should seek independent investment, legal, tax, accounting or other professional advice as appropriate. This information does not constitute an offer or solicitation by anyone in any jurisdiction. This information is not an advertisement and is not directed at any person in any jurisdiction where the publication or availability of the information is prohibited or restricted by law. Past performance is not a reliable indicator of future performance. Any comments about investments are not a recommendation to buy, sell or hold. Any views expressed on individual stocks or other investments, or any forecasts or estimates, are point in time views and may be based on certain assumptions and qualifications not set out in part or in full in this information. The views and opinions contained herein are those of the authors as at the date of publication and are subject to change due to market and other conditions. Such views and opinions may not necessarily represent those expressed or reflected in other MBA communications, strategies or funds. Information derived from sources is believed to be accurate, however such information has not been independently verified and may be subject to assumptions and qualifications compiled by the relevant source and this information does not purport to provide a complete description of all or any such assumptions and qualifications. To the extent permitted by law, neither MBA, nor any of its related parties, directors or employees, make any representation or warranty as to the accuracy, completeness, reasonableness or reliability of the information contained herein, or accept liability or responsibility for any losses, whether direct, indirect or consequential, relating to, or arising from, the use or reliance on any part of this information. Neither MBA, nor any of its related parties, directors or employees, make any representation or give any guarantee as to the return of capital, performance, any specific rate of return, or the taxation consequences of, any investment. This information is current at the date of publication and is subject to change at any time without notice. © 2023 Maple-Brown Abbott Limited.

Garth
Interested in investing with us?
Investment Insights

Of Burritos and (inedible) Chips

The tale of two research trips: AI fizz in the US meets gloom across the ditch