
Viewpoint
- The impact that Nvidia and its cohort have had on the market and related sentiment cannot be overstated. We have a US market that appears to be built on exceptionally flimsy foundations and with the US now being nearly two thirds of the World Index, there is potential for a much wider impact.
- We believe Australian equities do not have the same set of factors driving it as does the US with the Magnificent 7, although in our view we do have a level of valuation excess.
- The listing of Guzman y Gomez in mid-June provided a further fascinating insight into valuation extremes. The day one share price pop, a sky-high valuation and extremely optimistic growth ambitions ensure this new entrant will be very closely watched by investors.
The resilience of the Australian and other major markets in the face of a lengthy list of geo-political and economic challenges is impressive – if somewhat surprising. Even more impressive is the performance of the S&P 500 which has again recorded significant new highs during the quarter, largely on the back of the so-called Magnificent 7 (perhaps better known as the Extraordinary 1!).
The impact that Nvidia and its cohort have had on the market and related sentiment, evenly globally, cannot be overstated and the gulf in the performance differential between the S&P 493 and the seven is well known. Recent analysis by Citi suggests the only sector of the US market attracting flows is Tech. A review of the stark underperformance of many US money managers against their benchmark highlights the impact that the narrow market is having on flows, or perhaps the impact the flows are having in creating a narrow market. Whichever way one looks at it, we have a US market that appears to be built on exceptionally flimsy foundations and with the US now being nearly two thirds of the World Index, having the potential for a much wider impact.
Nvidia Price Earnings multiple remains at elevated levels despite an extraordinary increase in earnings
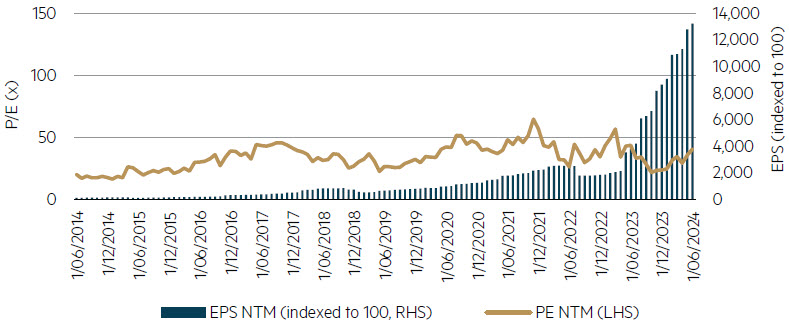
Source: FactSet, data to 30 June 2024.
The Nvidia story is unique in many ways
Nvidia does highlight the challenge for analysts in seeking to forecast in such extraordinary circumstances. The increase in analyst forecasts has been nothing short of breathtaking and when these forecast changes are associated with a price earnings (PE) multiple that has directionally tracked earnings, it is easy to understand how Nvidia briefly became the largest stock in the US during the quarter. At one point during June, Nvidia had added ~25% to its share price in the month of June alone, before falling back! Many point to the differences between the Tech Bubble of the late nineties and the current surge in the NASDAQ, suggesting that a key difference in 2024 is that the major stocks are all profitable. There is some truth to this, but it is worth noting that a stock such as Cisco was also profitable in 1999, had enjoyed a five-fold increase in earnings over five years and enjoyed a stellar PE re-rating. Cisco sold hardware that was to an extent the plumbing required for the Tech Bubble to take hold, but earnings fell sharply when the bubble burst. Although earnings have increased materially since that date, for the next 25 years the stock price has remained well below the peaks scaled at that time, as the stock suffered a material de-rating.
In an Australian context, many of the larger names caught up in the Tech Bubble were of the telco and media variety, remembering that it was the TMT Bubble (technology, media and telecommunications). Australia did not have many tech names of consequence in the late nineties but companies such as Telstra, Cable and Wireless Optus and News Corporation were all profitable and were swept along in the valuation bubble. As it turned out, profits were not sustained, and PE multiples that had scaled new heights were subsequently decimated. Twenty-five years later, Telstra trades at ~40% of its peak price of that time.
What if anything do we learn from these extreme events?
The most obvious lesson is that seeking to predict the development and subsequent demise of such cycles is an impossible task. The second lesson is probably that notwithstanding lesson one, we do need to have a view on these cycles! The impact of the cycle ending can be very significant and occasionally near-catastrophic (e.g. the GFC). Every cycle is different but particular vigilence is necessary where there is a sector of the market that drives broader market returns (i.e. poor market breadth), where PE multiples expand dramatically and where earnings surge on the back of a commodity price or product set. Strong returns in stocks that have little or no earnings is also a factor worthy of consideration, but it might be argued that a combination of surging earnings and a rising PE multiple is even more dangerous given the opportunity to compound the upside move, as we have seen with Nvidia.
Looking at our market today
We believe Australian equities do not have the same set of factors driving it as does the US with the Magnificent 7, although in our view we do have a level of valuation excess. The Australian market PE multiple at ~16.5 times (FactSet consensus) is at the 85th percentile high based on the last 25 years of data, reflecting a significant element of market enthusiasm. We see a similar picture when we look at the Industrials Index, where multiples are even more extended on a historic basis. At the same time earnings are also relatively high, helping explain why the market is at record highs (high earnings and high multiples). Given a market at record highs, there will always be pockets of significant overvaluation and as noted in our previous commentaries we do see this particularly in the industrial part of the market. To highlight one example, Commonwealth Bank is (neck and neck with BHP) the largest stock in our market (~$215bn market capitalisation) and trades on an exceptional (for a bank) ~22 times earnings, an extraordinary premium where the global average for banks is ~10 times earnings and where it is difficult to find large developed market banks trading at even 12 times earnings. Our market does have a selection of other premium priced industrial stocks such as Goodman Group, Macquarie Bank, Wesfarmers as well as a range of tech and related names (Car Sales, Real Estate Australia and Xero) where valuations also look extended, with PE multiples one to two standard deviations above longer-term averages.
Commonwealth Bank’s extraordinary valuation
| Bank | Share Price | Market Cap (USD bn) | FY24E PE | FY24E Price to Book | FY24E ROTE | FY24E Dividend Yield |
|---|---|---|---|---|---|---|
| Global | – | 8,378 | 10.3 | 1.5 | 14.5% | 4.5% |
| Selected Major Banks | ||||||
| JPMorgan Chase | $198.86 USD | 564 | 11.9 | 1.9 | 16.7% | 2.4% |
| Bank of America | $40.21 USD | 309 | 11.3 | 1.4 | 12.9% | 2.5% |
| Wells Fargo | $59.29 USD | 203 | 10.8 | 1.3 | 12.9% | 2.5% |
| RBC | $144.39 CAD | 149 | 11.6 | 2.1 | 18.9% | 3.9% |
| Toronto Dominion | $75.02 CAD | 97 | 9.0 | 1.5 | 17.1% | 5.4% |
| BOC HK | $24 HKD | 33 | 6.6 | 0.7 | 10.9% | 7.9% |
| Mitsubishi UFJ | $1580 JPY | 116 | 10.5 | 0.9 | 9.0% | 3.2% |
| HDFC | $1672 INR | 152 | 15.6 | 2.3 | 15.7% | 1.3% |
| DBS | $36 SGD | 74 | 9.9 | 1.5 | 15.8% | 6.2% |
| Commonwealth Bank of Australia | $127 AUD | 141 | 22.6 | 3.2 | 14.1% | 3.6% |
Source: Jefferies, FactSet estimate data as at 24 June 2024.
The listing of Guzman y Gomez in mid-June provided a further fascinating insight into valuation extremes, albeit on a smaller scale. As the biggest IPO since 2021, it was always going to draw significant attention. Of particular interest was the valuation, with the $22 listing price representing a heady 38 times forecast 2025 earnings before interest, tax, depreciation and amortisation, or 371 times forecast earnings! Such multiples necessitate significant earnings growth to justify share prices. In this case, management released long-term targets to grow the network from the current 185 stores to more than 1000 (after 50 years of operations, McDonalds currently has ~1000 stores in Australia). With a sky-high valuation and extremely optimistic growth ambitions, expectations may have been for a soft listing, rather than the 36% gain on day one!
Parting thought
We remain of the view that there is much to be vigilent about with our market around record highs. We do not see the same risks in our market that we see in the US, but it would be unwise to assume that any significant correction in the NASDAQ and the broader US market will leave other market indices, including ours, untouched. We continue to steer clear of the premium priced industrial stocks but recognise that the remaining universe of names is increasingly narrow and often populated with stocks that face significant idiosyncratic challenges. The strong rally in banks and insurers has further reduced the pool of attractive investment opportunities and we are increasingly finding ourselves attracted to the energy names and defensive stocks that have underperformed while the market has traded to new highs.
Disclaimer
This information is prepared and issued by Maple-Brown Abbott Ltd ABN 73 001 208 564, AFSL. 237296 (‘MBA’) as the Responsible Entity of the Maple-Brown Abbott Australian Share Fund – Wholesale ARSN 087 294 504 (‘Fund’). This article contains general information only, and does not take into account your investment objectives, financial situation or specific needs. Before making a decision whether to acquire, or to continue to hold an investment in the Fund, investors should obtain independent financial advice and consider the current PDS and Target Market Determination (TMD) or any other relevant disclosure document of those products. For the Fund, the PDS, AIB and TMD are available at maple-brownabbott.com/document-library or by calling 1300 097 995. Any views expressed on individual stocks or other investments, or any forecasts or estimates, are not a recommendation to buy, sell or hold, they are point in time views and may be based on certain assumptions and qualifications not set out in part or in full in this document. The individual stocks referred to may or may not be currently held by the Fund. Information derived from sources is believed to be accurate, however such information has not been independently verified and may be subject to assumptions and qualifications not described in this document. To the extent permitted by law, neither MBA, nor any of its related parties, directors or employees, make any representation or warranty as to the accuracy, completeness, reasonableness or reliability of this information, or accept liability or responsibility for any losses, whether direct, indirect or consequential, relating to, or arising from, the use or reliance on this information. This information is current as of 12 July 2024 and is subject to change at any time without notice. © 2024 Maple-Brown Abbott Limited.

Dougal joined Maple-Brown Abbott in 2001 as an equity analyst. He is currently a portfolio manager and equities analyst. Dougal was an Executive Director from July 2009 to October 2018. Dougal’s responsibilities include equity analysis and portfolio management, including managing a large number of institutional and retail accounts. He attended the Advanced Management Program at Harvard Business School in 2014. Prior to joining Maple-Brown Abbott Dougal worked in a national law firm and at an international investment bank.
Board and committee membership:
Asset Allocation Committee
Dougal
Interested in investing with us?
Investment Insights

Of Burritos and (inedible) Chips

The tale of two research trips: AI fizz in the US meets gloom across the ditch