
Viewpoint
- Analysis of lead indicators for consumer spending patterns
- Can the buoyant retail environment continue?
- Where do we see opportunities in the retail sector
For any student of economic history, it’s self-evident that economies and markets move in cycles. While this reality appears obvious, the elongated cycle that endured over the past decade may have caught investors in an illusion that this decade may revert back to the ‘good times’ – that market price weakness is short, temporary and likely to see another elongated bull market ensue. The retail sector is a good example, with consistently elevated sales levels in the period post-COVID, however we believe this will begin to unwind over the remainder of 2023.
Coming out of the February 2023 reporting season, it’s clear that both consumers and businesses are preparing for the economic uncertainty ahead, given the steep interest rate hike cycle by the RBA (10 hikes since May 2022). Data analysis supports the view that retailers will face a more challenging 12 months ahead as consumers adjust their financial decision-making to account for the new economic regime.
Correlation analysis going back to the early 1980s in the chart below highlights that Australian house prices, housing turnover and the unemployment rate are key determinants of future expectations of consumer spending and retail sales growth.
Retail sales correlation (1 year rolling)
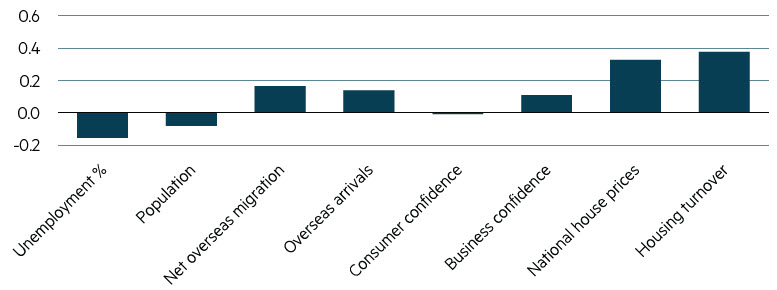
Source: MBA, Australian Bureau of Statistics, September 1982 to December 2022.
When considering the confluence of leading economic indicators – the normalisation of savings rates, low unemployment rate, high household debt, slowing house prices/turnover, fixed mortgage interest rates rolling into variable rates and, to a lesser extent, general confidence in the global banking system – it creates a toxic mix for businesses reliant on the financial health and confidence of the consumer.
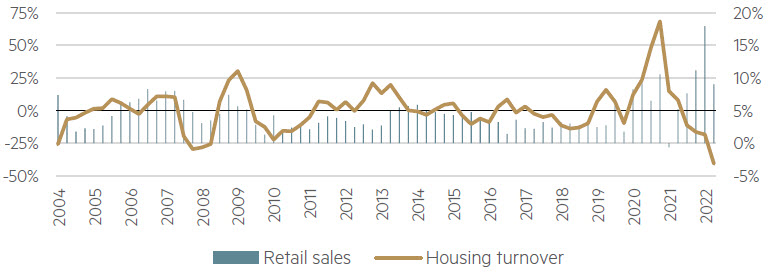
While this hasn’t fully materialised yet, the data so far suggests that house prices and turnover are the biggest factors in driving retail sales, and with national house prices falling around 10% in the past year, and housing turnover declining rapidly towards the end of 2022 by over 20% (see charts below), the stage has been set for weaker retail sales in 2023. This has already started to come through for housing related retailers, with weak 2023 calendar year trading updates for Nick Scali (-12.1% written sales order growth),1 Temple & Webster(-7% sales growth)2 and Harvey Norman (-10.2% Australian sales growth)3.
Retail sales vs National House Price changes (%)
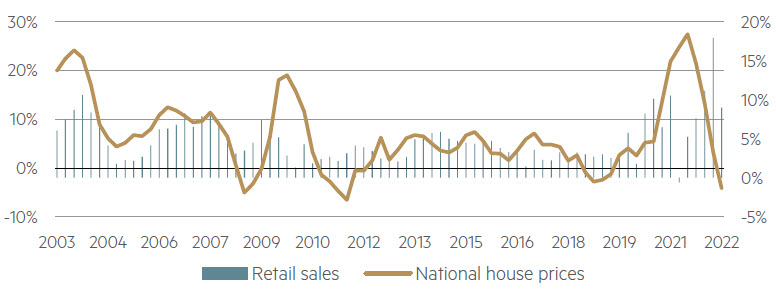
Source: MBA, Australian Bureau of Statistics, June 2003 to December 2022.
It’s unsurprising that consumer spending should slow provided that approximately two-thirds of Australian households own their own home, half of which carries a mortgage.4 In addition, almost 20% of Australians own an investment property.5 This presents significant balance sheet risks for households as house prices fall, leading to constrained budgets, income shocks and ultimately an unfavourable wealth effect for broader economic activity.
Net overseas migration and overseas arrivals have the potential to be a positive offset (to some extent), and the key factor to watch is the unemployment rate, given that continues at ultralow levels and can have a material impact on retail sales if it starts rising. Surprisingly, the data shows that consumer confidence has historically been a poor predictor of retail sales growth – so ignore the headlines!
Parting thought
We remain cautious on retailers but nonetheless find opportunities in select consumer names with a favourable customer base that is, for the most part, insulated from the effect of interest rate increases. Youth focused retailers such as Lovisa Holdings have, in our view, defied the broader trend of weakness with consistently good top line growth, a large global store roll-out program, and strong return metrics. The company is leveraged to younger female consumers who are less affected by interest rate rises and mortgage repayments, and an average price point of around $20 presents the offering as an affordable option in the jewellery and accessories category.
1 Nick Scali, FY23 Half Year Results Presentation, 6 February 2023.
2 Temple & Webster, H1 FY23 Investor Presentation, 14 February 2023.
3 Harvey Norman, Half Year Results Presentation, 28 February 2023.
4 www.aihw.gov.au/reports/australias-welfare/home-ownership-and-housing-tenure.
5 Australian Taxation Office (2019–20).
Disclaimer
This information was prepared and issued by Maple-Brown Abbott Ltd ABN 73 001 208 564, Australian Financial Service Licence No. 237296 (“MBA”). This information must not be reproduced or transmitted in any form without the prior written consent of MBA. This information does not constitute investment advice or an investment recommendation of any kind and should not be relied upon as such. This information is general information only and it does not have regard to any person’s investment objectives, financial situation or needs. Before making any investment decision, you should seek independent investment, legal, tax, accounting or other professional advice as appropriate. This information does not constitute an offer or solicitation by anyone in any jurisdiction. This information is not an advertisement and is not directed at any person in any jurisdiction where the publication or availability of the information is prohibited or restricted by law. Past performance is not a reliable indicator of future performance. Any comments about investments are not a recommendation to buy, sell or hold. Any views expressed on individual stocks or other investments, or any forecasts or estimates, are point in time views and may be based on certain assumptions and qualifications not set out in part or in full in this information. The views and opinions contained herein are those of the authors as at the date of publication and are subject to change due to market and other conditions. Such views and opinions may not necessarily represent those expressed or reflected in other MBA communications, strategies or funds. Information derived from sources is believed to be accurate, however such information has not been independently verified and may be subject to assumptions and qualifications compiled by the relevant source and this information does not purport to provide a complete description of all or any such assumptions and qualifications. To the extent permitted by law, neither MBA, nor any of its related parties, directors or employees, make any representation or warranty as to the accuracy, completeness, reasonableness or reliability of the information contained herein, or accept liability or responsibility for any losses, whether direct, indirect or consequential, relating to, or arising from, the use or reliance on any part of this information. Neither MBA, nor any of its related parties, directors or employees, make any representation or give any guarantee as to the return of capital, performance, any specific rate of return, or the taxation consequences of, any investment. This information is current at 30 March 2023 and is subject to change at any time without notice. © 2023 Maple-Brown Abbott Limited.

William Hanna joined Maple-Brown Abbott in July 2022 as Investment Analyst, Australian Small Companies. A key focus of William’s role is to conduct detailed stock research and analysis of Australian small cap companies, as well as support the portfolio managers in the Australian Small Companies team.
Before joining Maple-Brown Abbott, William worked as Investment Analyst at JANA, a leading investment consultant, focused on Australian Equities and REITs research as well as providing investment strategy advice to institutional funds.
William
Interested in investing with us?
Investment Insights

Of Burritos and (inedible) Chips

The tale of two research trips: AI fizz in the US meets gloom across the ditch