
2024 Review and 2025 Outlook for Australian Equities
Looking back at 2024, history will record that the Australian equity market produced a slightly higher than ‘average’ total return of around 11%. However, that very “normal” looking return hides a huge dichotomy in the equity market: between the ‘haves’ and the ‘have nots’.
Leading the “haves” during 2024 tech produced a total return of ~ 50%, closely followed by financials (led by the banks) up over 30%. On the flipside both energy and materials (led by resources) both produced double digit negative returns!
What is remarkable is that this story looks very similar to calendar 2023 when the market produced a total return ~ 12%. Whilst the sector returns were not as diverse (all the major sectors produced positive returns in 2023) the best performing sector was once again tech with a return of almost 30%. It should be noted that in 2023 energy was once again one of the poorest performing sectors although for completeness both financials and materials were market performers in 2023.
| 2023 | 2024 | |
|---|---|---|
| Tech | 28% | 48% |
| Financials | 11% | 34% |
| Consumer discretionary | 22% | 23% |
| Market | 12% | 11% |
| Materials | 15% | -14% |
| Energy | 5% | -14% |
The breakdown of the sector returns over both 2023 and 2024 highlights that 2024 was a year for momentum investors: sectors / stocks that did well in 2023 generally continued to do well in 2024 and visa versa.
A few extreme examples of the “haves” at a stock level include Seven Group (up ~ 80% in 2023 and a further ~ 30% in 2024), Pro Medicus (~ 70% in 2023 and then a remarkable > 160% in 2024), REA (~ 65% and then 30%), Xero (~60% and 50%) and Life360 (55% and a chart topping ~ 200%!).
The other unusual factor at play during 2024 was that returns were generally driven by a price earnings (PE) multiple rerating rather than earnings growth. The chart below highlights this.
Index returns from start of 2024
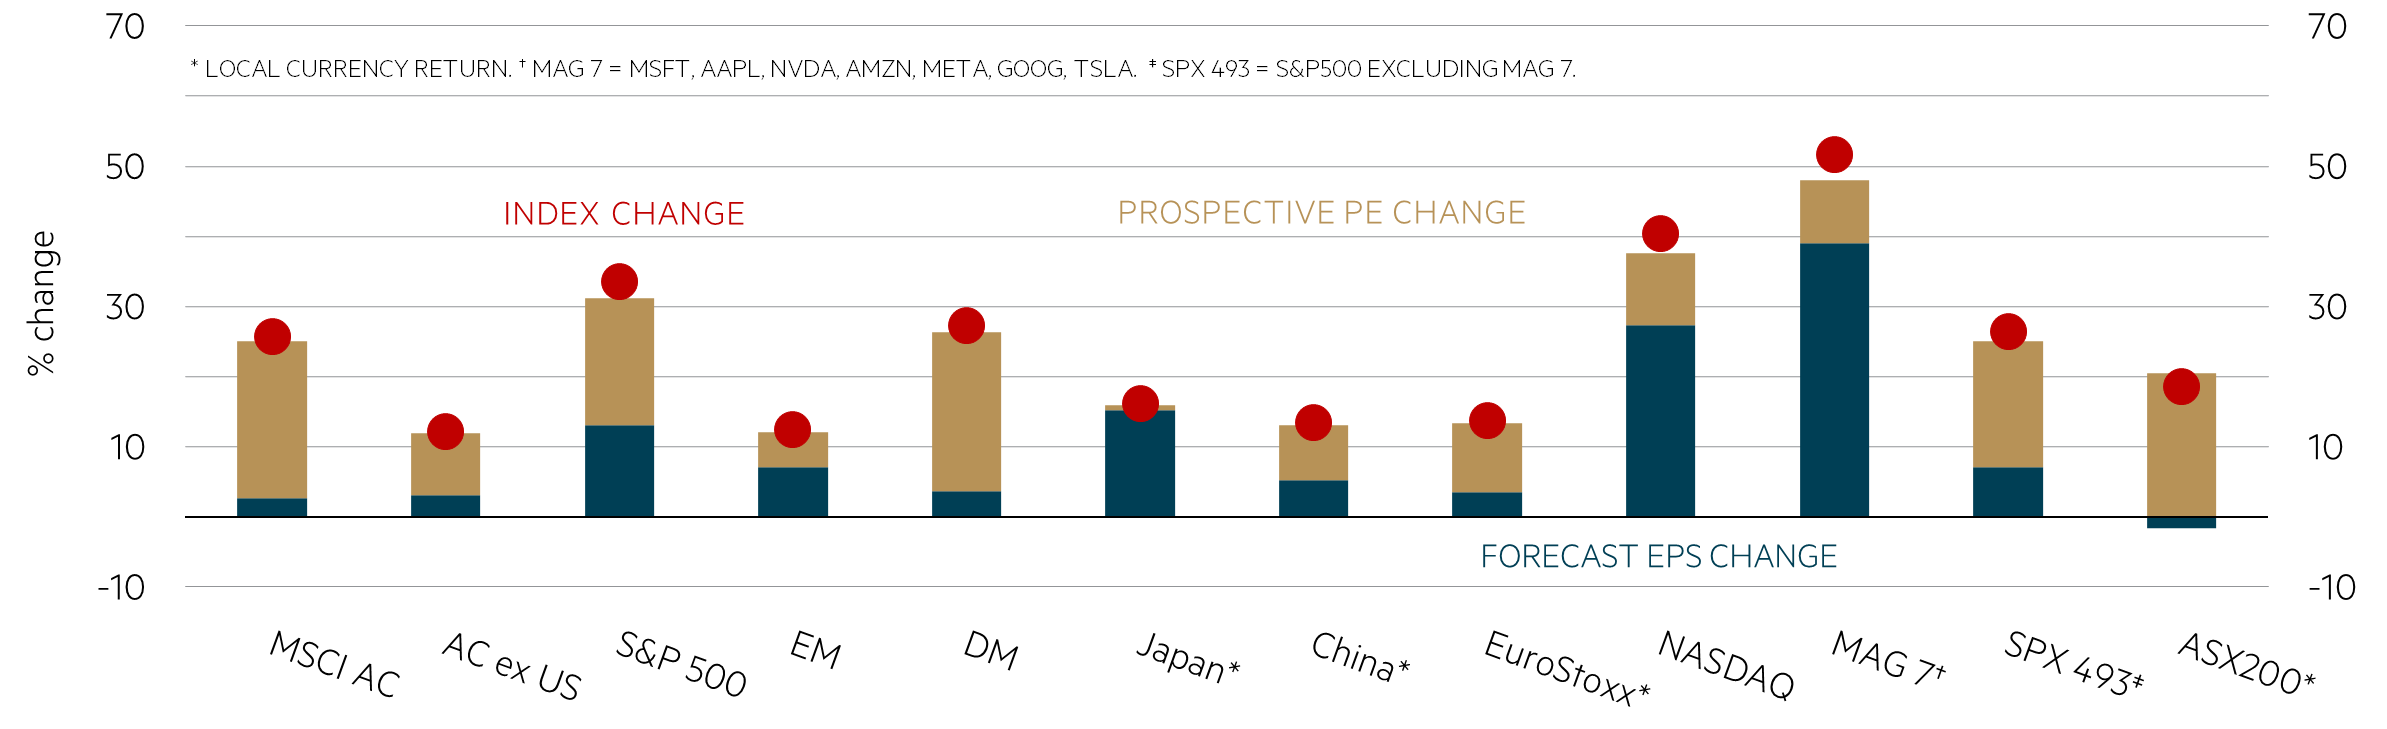
* Local currency return. † MAG 7 = MSFT, AAPL, NVDA, AMZN, META, GOOG, TSLA. ‡ SPX 493 = S&P500 excluding MAG 7. Source: Minack Advisors, compiled on 19 December 2024.
The chart shows the positive impact PE multiple expansion has played at driving equity market returns given expectations that easier monetary policy will be supportive of markets. The chart also highlights that Australia is the only market of the 12 listed above where strong market returns have been generated in conjunction with a decline in forecast earnings. We consider this is a highly unusual outcome and is primarily due to strong returns from the banks despite a backdrop of unchanged earnings expectations. The premium that has been accorded to such companies is startling, with the spread between the highest and lowest rated quintiles of industrial stocks now well ahead of that seen during the COVID peaks. The cheapest quintiles of Australian stocks have largely been ignored by the market with the lowest quintile of companies trading at PE multiples of around 10 times.
Outlook for 2025
Given the dominance of momentum investing and the extremes in valuation dispersion, it is tempting to call for a reversal in 2025. However, we caution that these excesses can continue for longer than anyone expects.
Financials
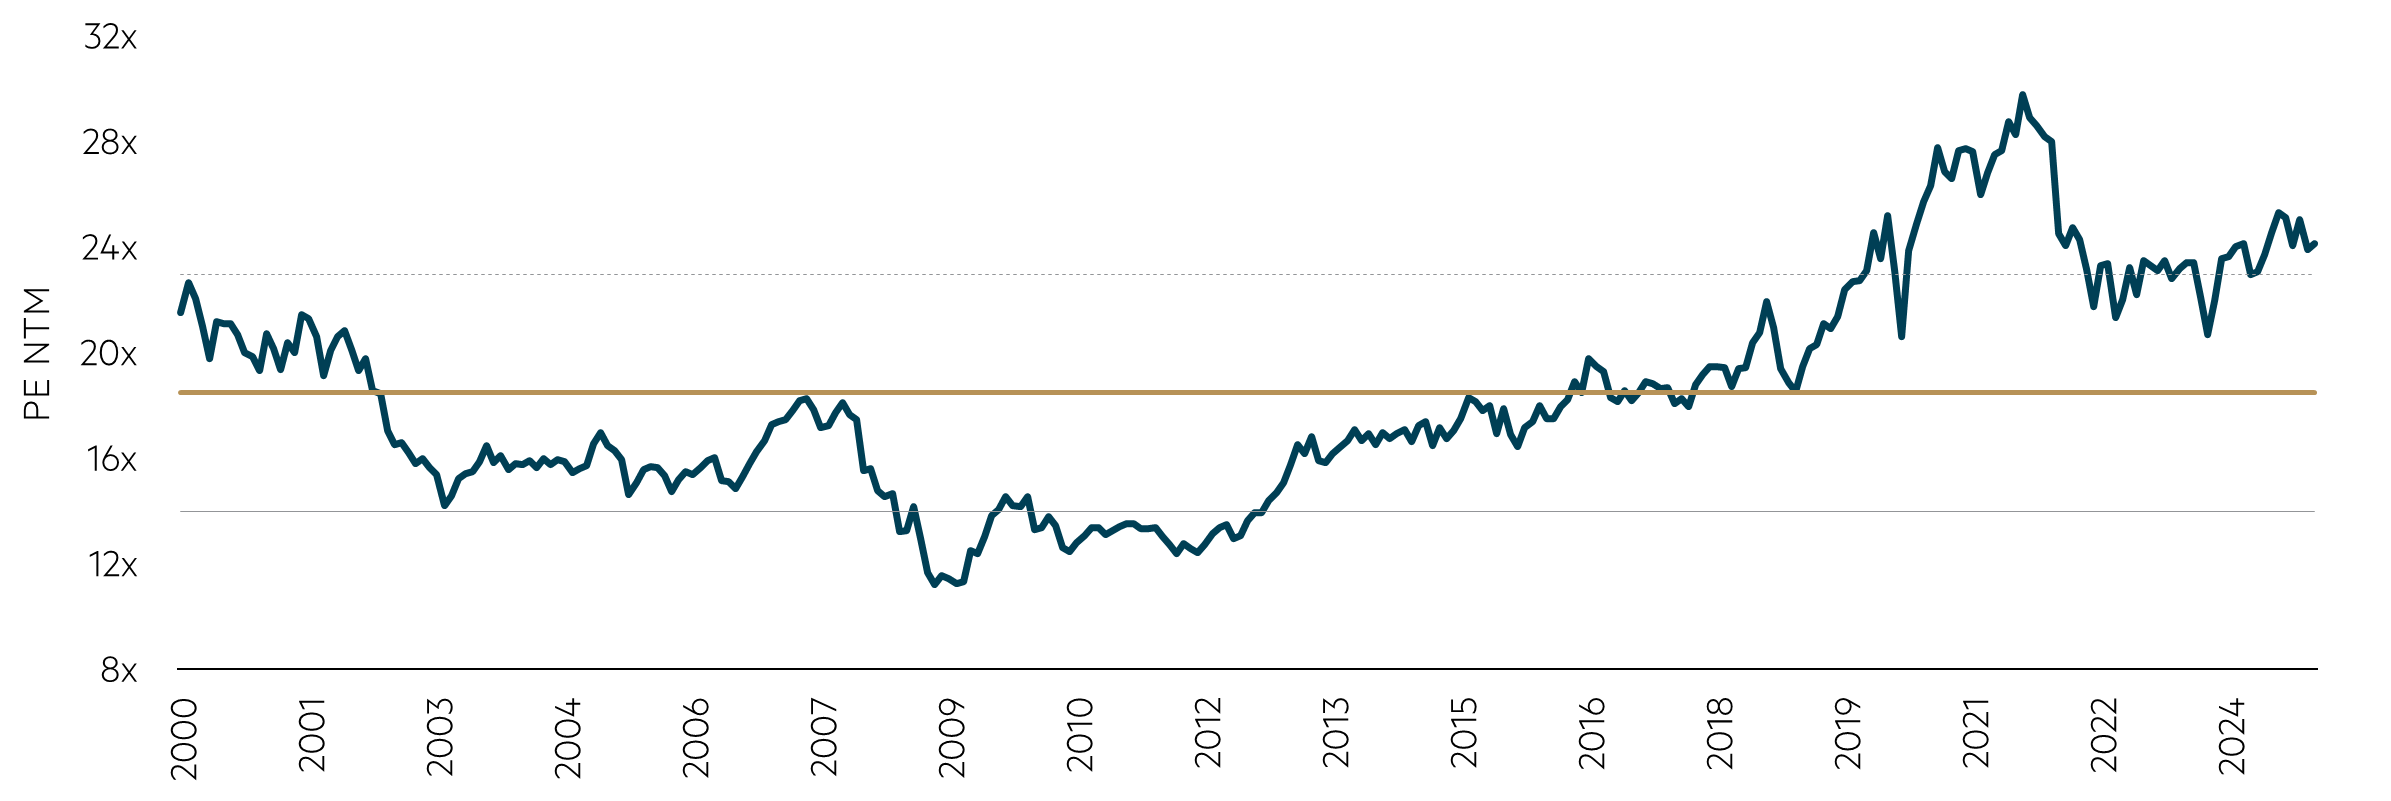
Banks with limited, if any, earnings growth and already full valuations are unlikely to provide much support for the market in 2025. The banks themselves comprise almost a quarter of the Australian equity market with CBA over 10%. If the banks hold their current ratings, investors should expect only the dividend yield as the return in 2025. Note that the current forecast CBA dividend yield is a little over 4% on a gross basis (i.e. including franking).
S&P/ASX 300 banks – PE (NTM)
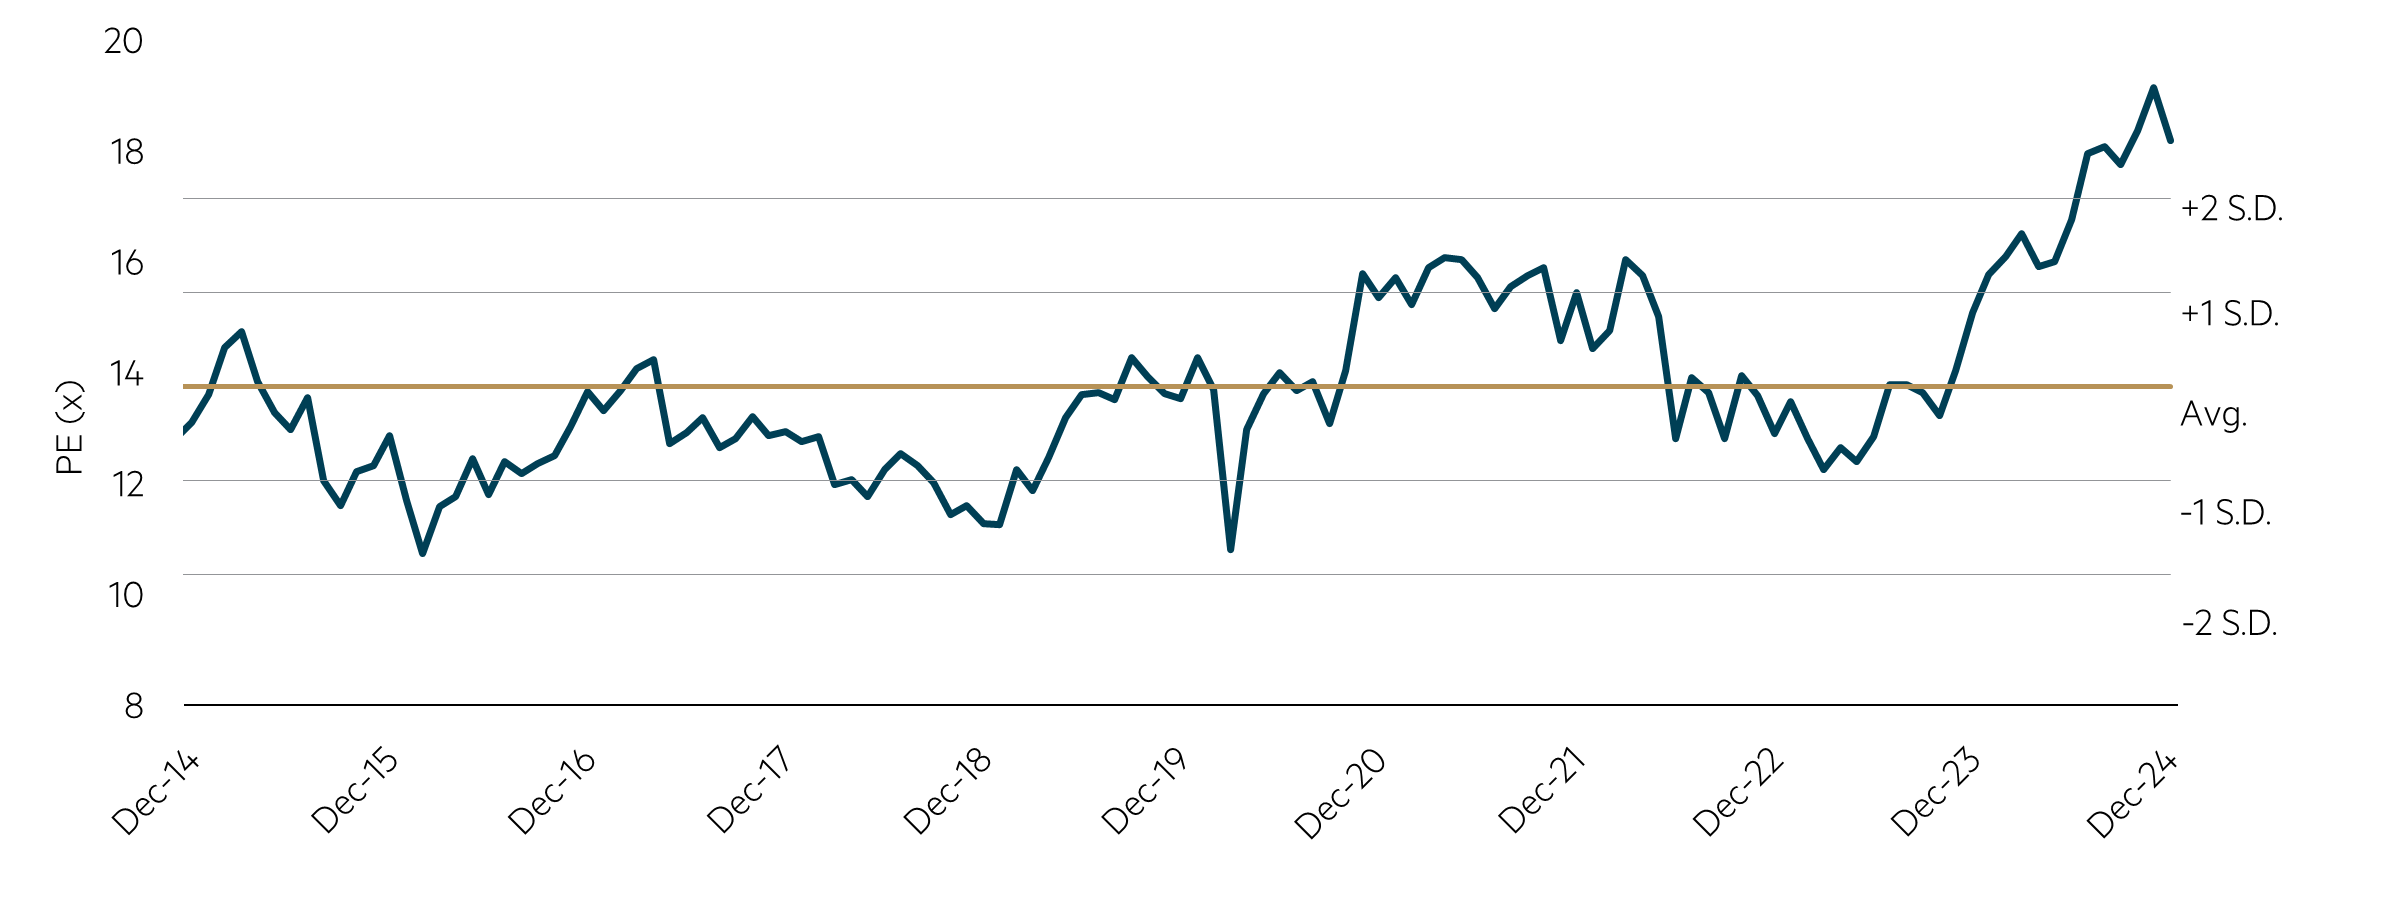
Source: FactSet, data to 31 December 2024.
Whilst the outlook for bank returns looks quite tepid, hence our underweight positioning, we believe the outlook for the general insurers is slightly more positive. Insurance premiums are still growing and interest rates domestically have remained higher for longer.
Resources
Resources (the miners plus energy) also comprise around a quarter of our equity market. As noted above, these sectors have been material laggards in 2024 and in the case of energy, also in 2023.
We continue to see appeal in the energy sector and selected resources, given discount valuations and strong balance sheets. The chart below suggests that Energy earnings are below the long term average and multiples are inexpensive relative to the market.
S&P/ASX 300 Energy – EPS (NTM)
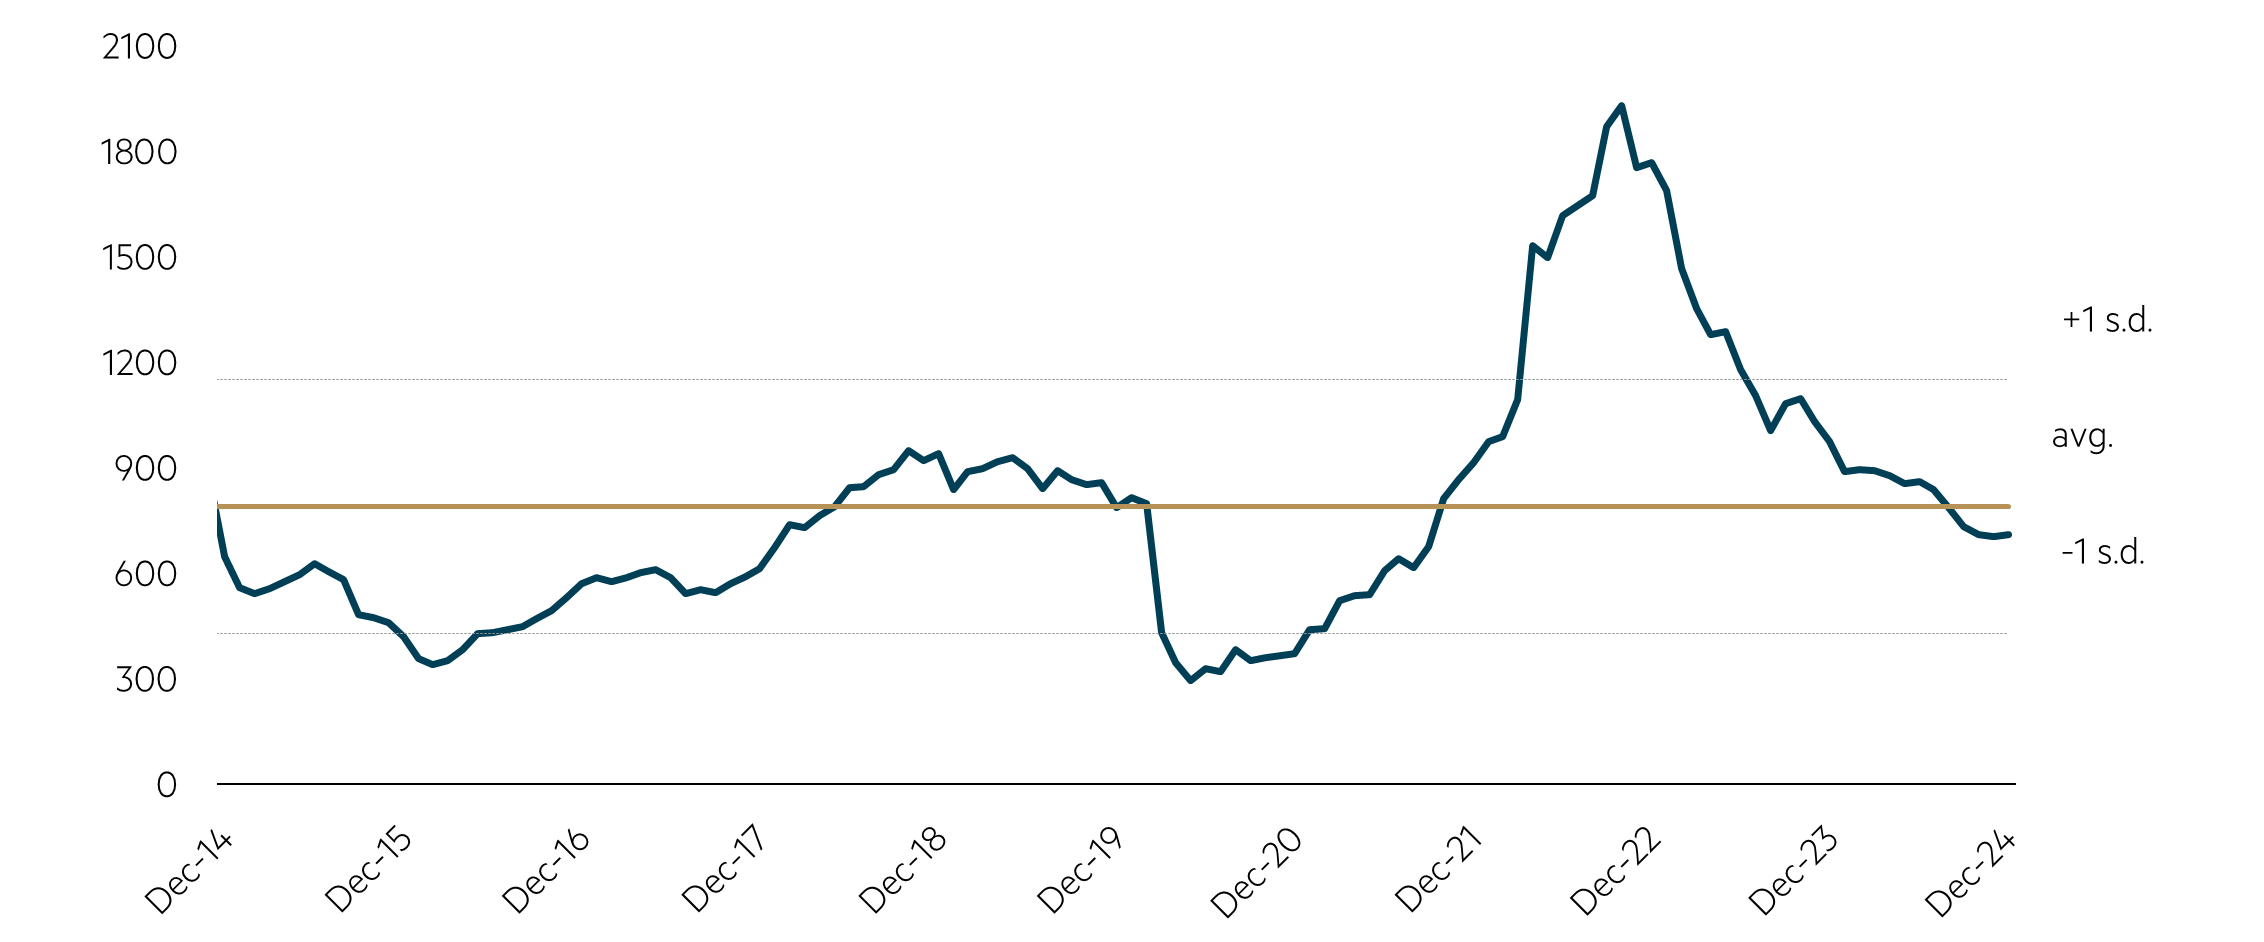
Source: FactSet, data to 31 December 2024.
S&P/ASX 300 Energy – PE (NTM) relative to S&P/ASX 300
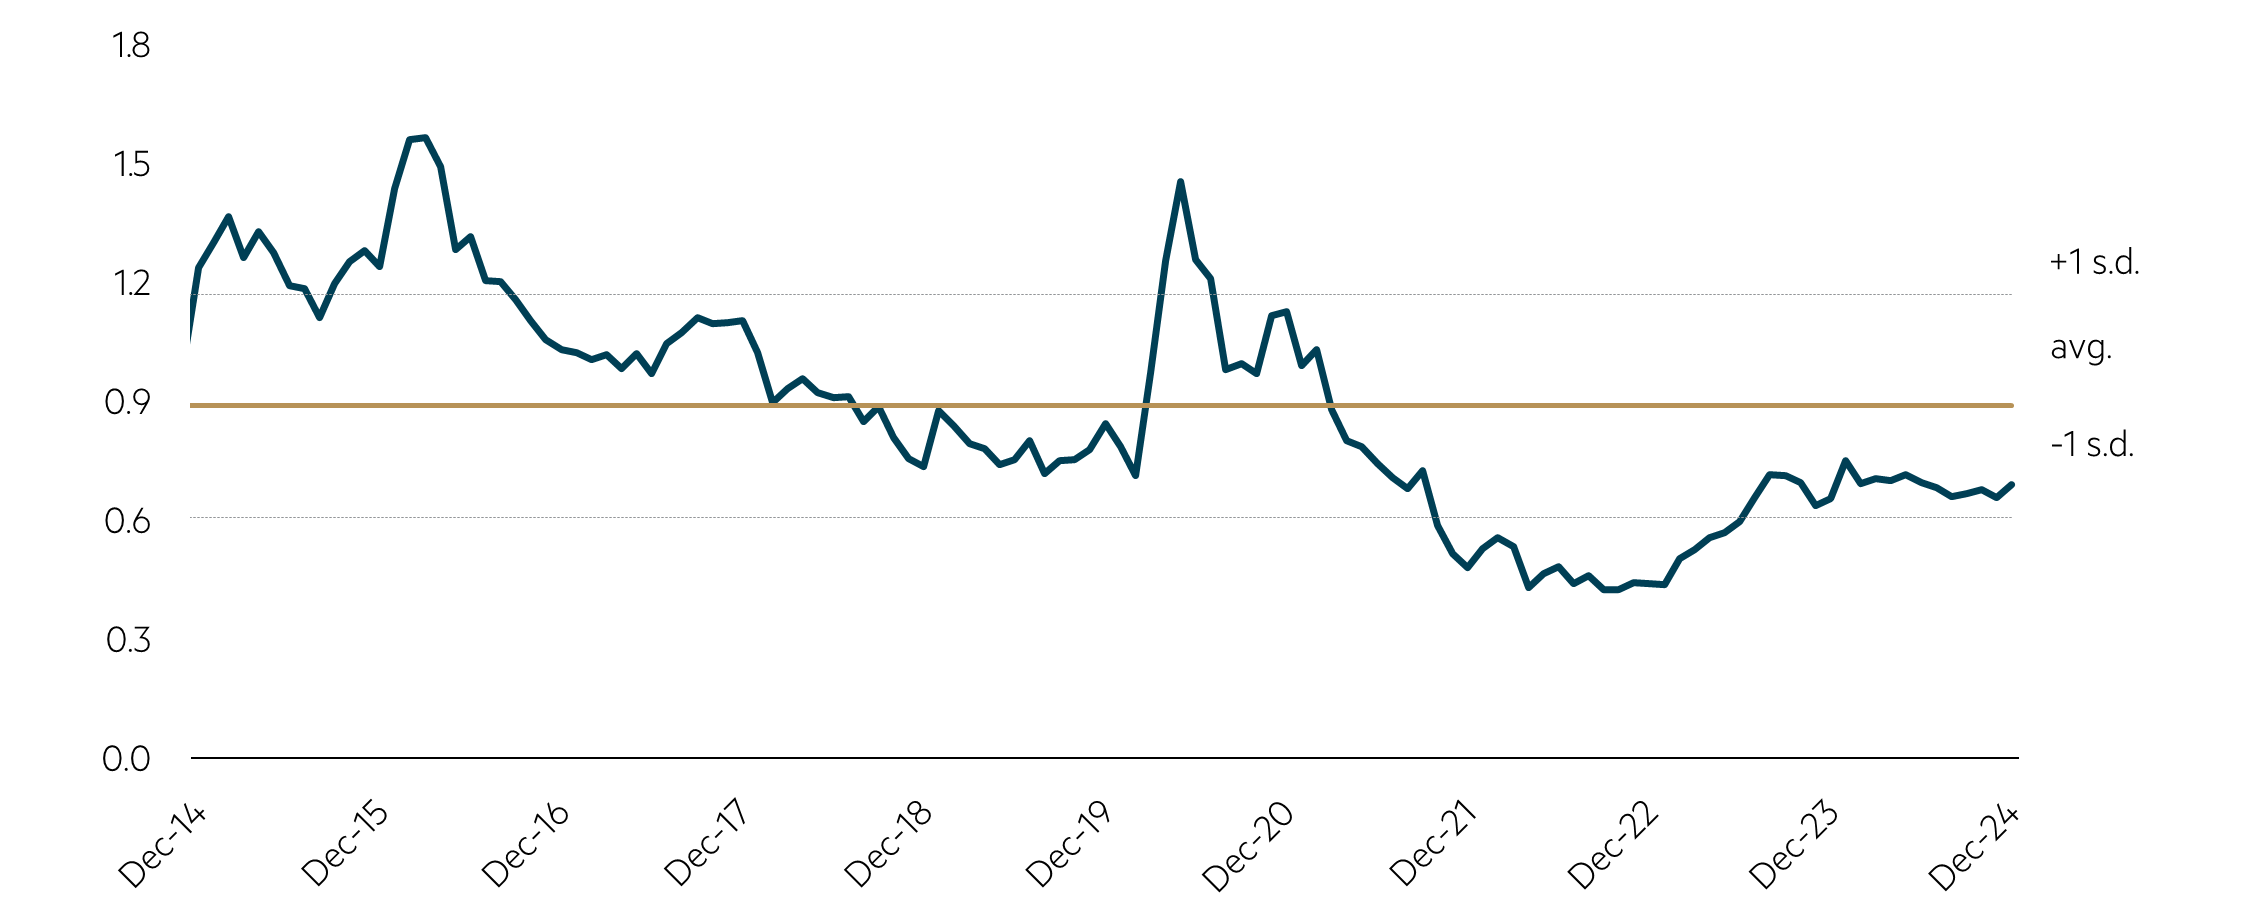
Source: FactSet, data to 31 December 2024.
Industrials (ex financials)
On average, appear to us to be trading expensive, albeit down from the extremes during the pandemic. Within the industrial names we are finding better value amongst many defensives as they now offer attractive valuations and some protection against equity market uncertainties.
Industrials firms trade at an average forward PE of 24.3x, which is 32% above the 20-yr average
Source: Goldman Sachs, FactSet, data to January 2025.
Overall, we believe that there are opportunities across various sectors of the Australian market and that an experienced and skilled active manager with a focus on valuation can take advantage of these opportunities to deliver strong risk adjusted performance outcomes for investors.
Disclaimer
This article was prepared and issued by Maple-Brown Abbott Ltd ABN 73 001 208 564, AFSL No. 237296 (“MBA”). This information is general information only and it does not have regard to any person’s investment objectives, financial situation or needs. Before making any investment decision, you should seek independent investment, legal, tax, accounting or other professional advice as appropriate, and obtain the relevant Product Disclosure Statement and Target Market Determination for any financial product you are considering. This information does not constitute an offer or solicitation by anyone in any jurisdiction. Past performance is not a reliable indicator of future performance. Any views expressed on individual stocks or other investments, or any forecasts or estimates, are point in time views and may be based on certain assumptions and qualifications not set out in part or in full in this information. The views and opinions contained herein are those of the authors as at the date of publication and are subject to change due to market and other conditions. Such views and opinions may not necessarily represent those expressed or reflected in other MBA communications, strategies or funds. Any companies, securities and or/case studies referenced or discussed are used only for illustrative purposes. The information provided is not a recommendation for any particular security or strategy, and is not an indication of the trading intent of MBA. Information derived from sources is believed to be accurate, however such information has not been independently verified and may be subject to assumptions and qualifications compiled by the relevant source and this information does not purport to provide a complete description of all or any such assumptions and qualifications. To the extent permitted by law, neither MBA, nor any of its related parties, directors or employees, make any representation or warranty as to the accuracy, completeness, reasonableness or reliability of the information contained herein, or accept liability or responsibility for any losses, whether direct, indirect or consequential, relating to, or arising from, the use or reliance on any part of this information. This information is current at 31 December 2024 and is subject to change at any time without notice. © 2025 Maple-Brown Abbott Limited.

Dougal joined Maple-Brown Abbott in 2001 as an equity analyst. He is currently a portfolio manager and equities analyst. Dougal was an Executive Director from July 2009 to October 2018. Dougal’s responsibilities include equity analysis and portfolio management, including managing a large number of institutional and retail accounts. He attended the Advanced Management Program at Harvard Business School in 2014. Prior to joining Maple-Brown Abbott Dougal worked in a national law firm and at an international investment bank.
Board and committee membership:
Asset Allocation Committee
Dougal
Interested in investing with us?
Investment Insights

The case for holding resources in an Australian small caps fund

The gold rush in the small caps market

Australian Equities March 2025 update