
The pause that refreshes, or …
The March quarter saw considerable economic and political turmoil following the inauguration of President Trump and unsurprisingly markets responded accordingly. What has been surprising however is that it is the US market that has seen weakness while European markets have strongly outperformed, notwithstanding a host of uncertainties relating to American economic and political relationships with Europe. Valuation differentials were, however, very much in favour of Europe and so in that sense relative price movements are easily justified. Our market had a soft quarter (S&P/ASX 300 Total Returns fell 2.9%) but this does mask a larger ~9% fall in the index from the peak in mid-February to the low in mid-March, before a small recovery later in the quarter.
| FY1 PE | Quarterly Return | |
|---|---|---|
| S&P 500 | 20.3 | -4.3% |
| NASDAQ | 23.4 | -8.1% |
| FTSE 100 | 12.1 | 6.1% |
| France CAC 40 | 14.3 | 5.8% |
| Germany DAX | 14.7 | 11.3% |
| Nikkei 225 | 17.8 | -10.0% |
| Hang Seng | 10.1 | 16.1% |
| Hang Seng China Enterprises | 9.6 | 17.6% |
Source: Bloomberg.
As noted in the December quarterly, our market produced strong returns in 2024 against a background of falling earnings, rising ~30% from the low seen end October 2023 to the high during this February. As we have been highlighting, these gains were generated by a narrow group of stocks (tech, financials and select industrials), where valuations became particularly stretched. This left the market vulnerable to price weakness and it was these stocks which led the way down in the correction we saw during February/March. Similarly, we saw a recovery in some of the laggards, particularly in selected defensive and resource names. Financials and Tech drove market returns from 2023 lows
But strong reversal in recent market correction
Total Return relative to S&P/ASX 300
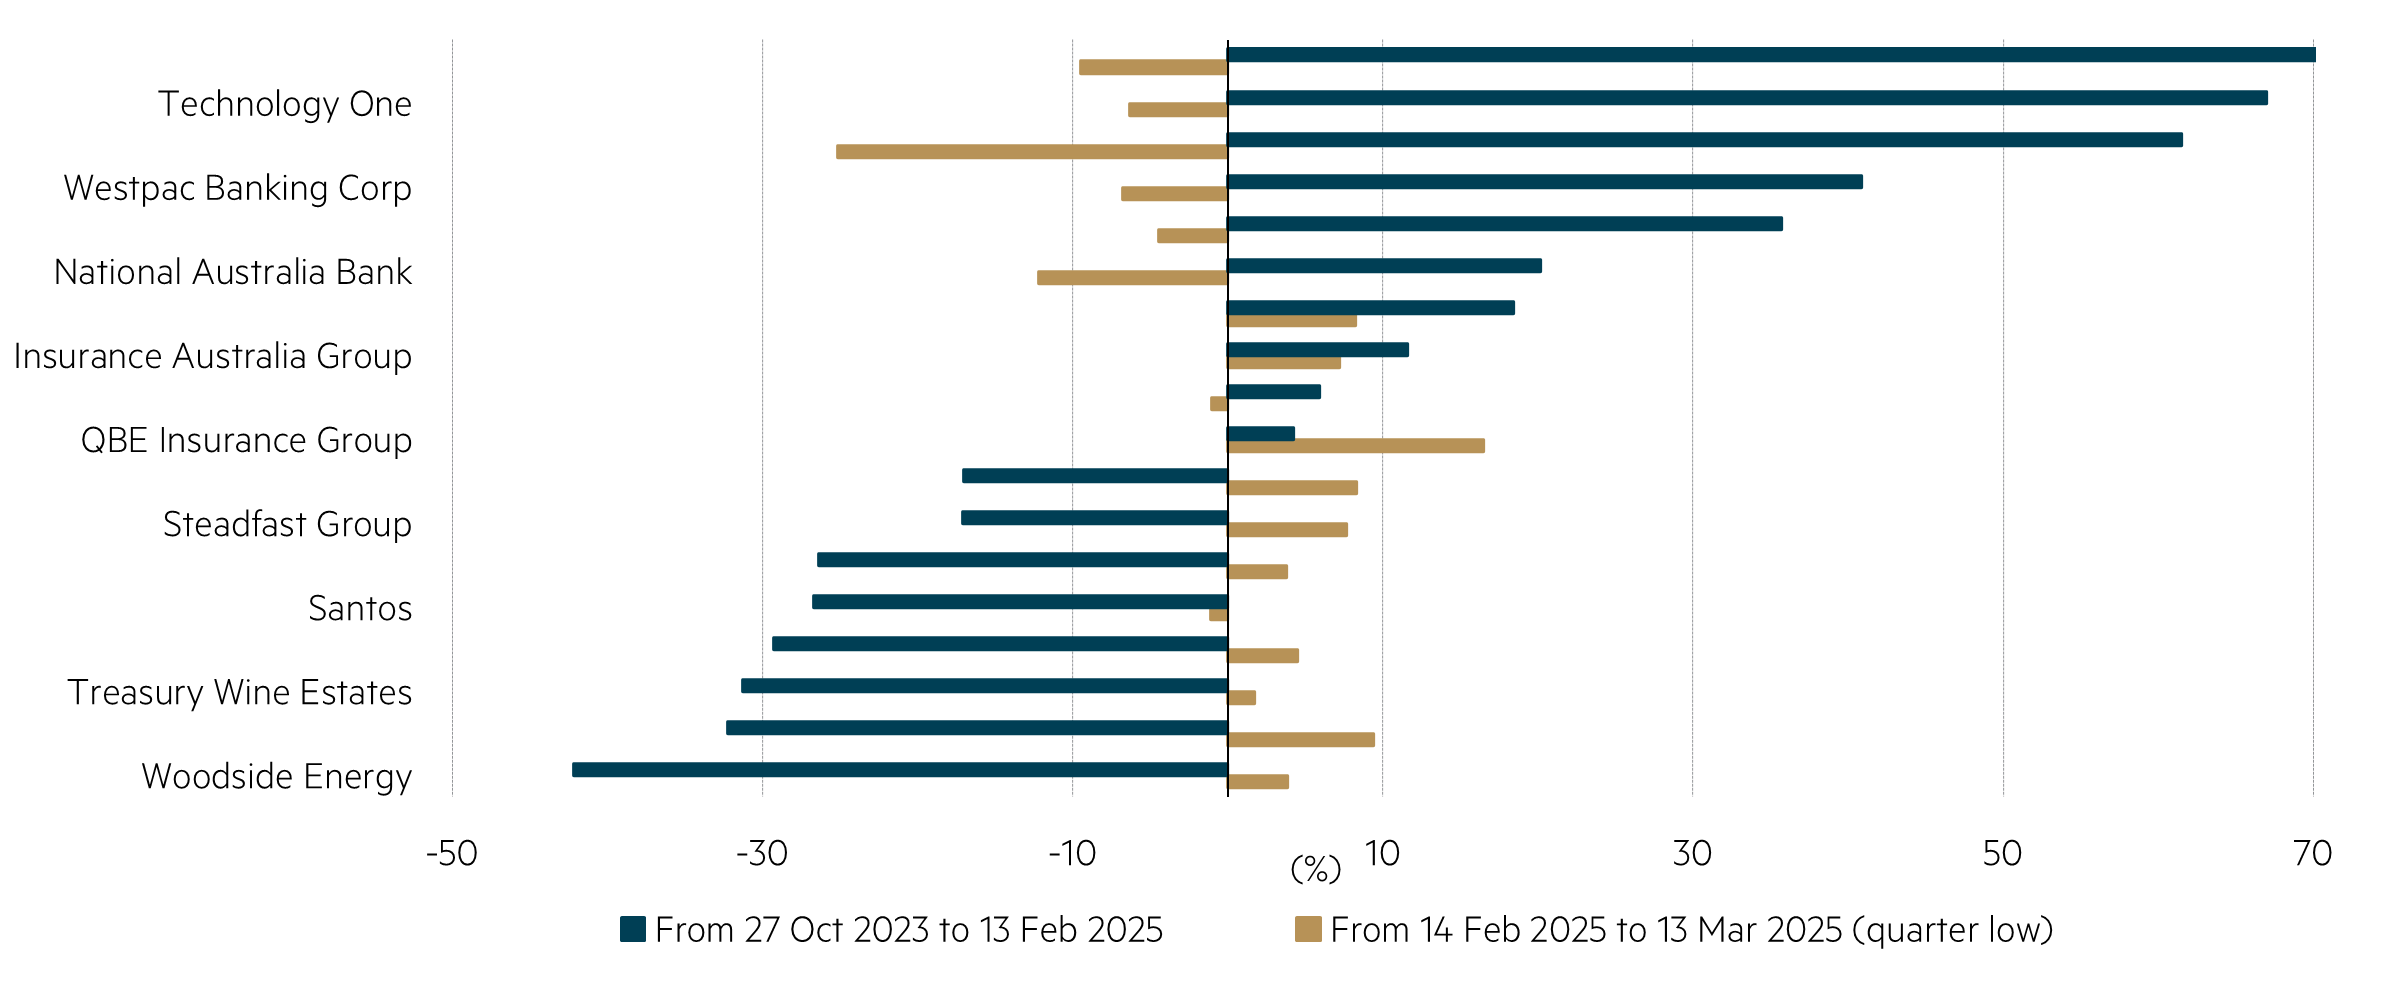
Source: FactSet.
In our view this reflects the extreme valuation differentials that prevailed. This is not to suggest that the valuation differentials have narrowed materially; they have not. By way of example, the chart below highlights that defensive stocks continue to trade at large discounts to historic averages relative to the Industrial benchmark, even after their recent performance bounce.
Defensive stocks have lagged in a strong market
Valuations are attractive relative to recent trading history
Valuation of major defensive stocks in the ASX 200
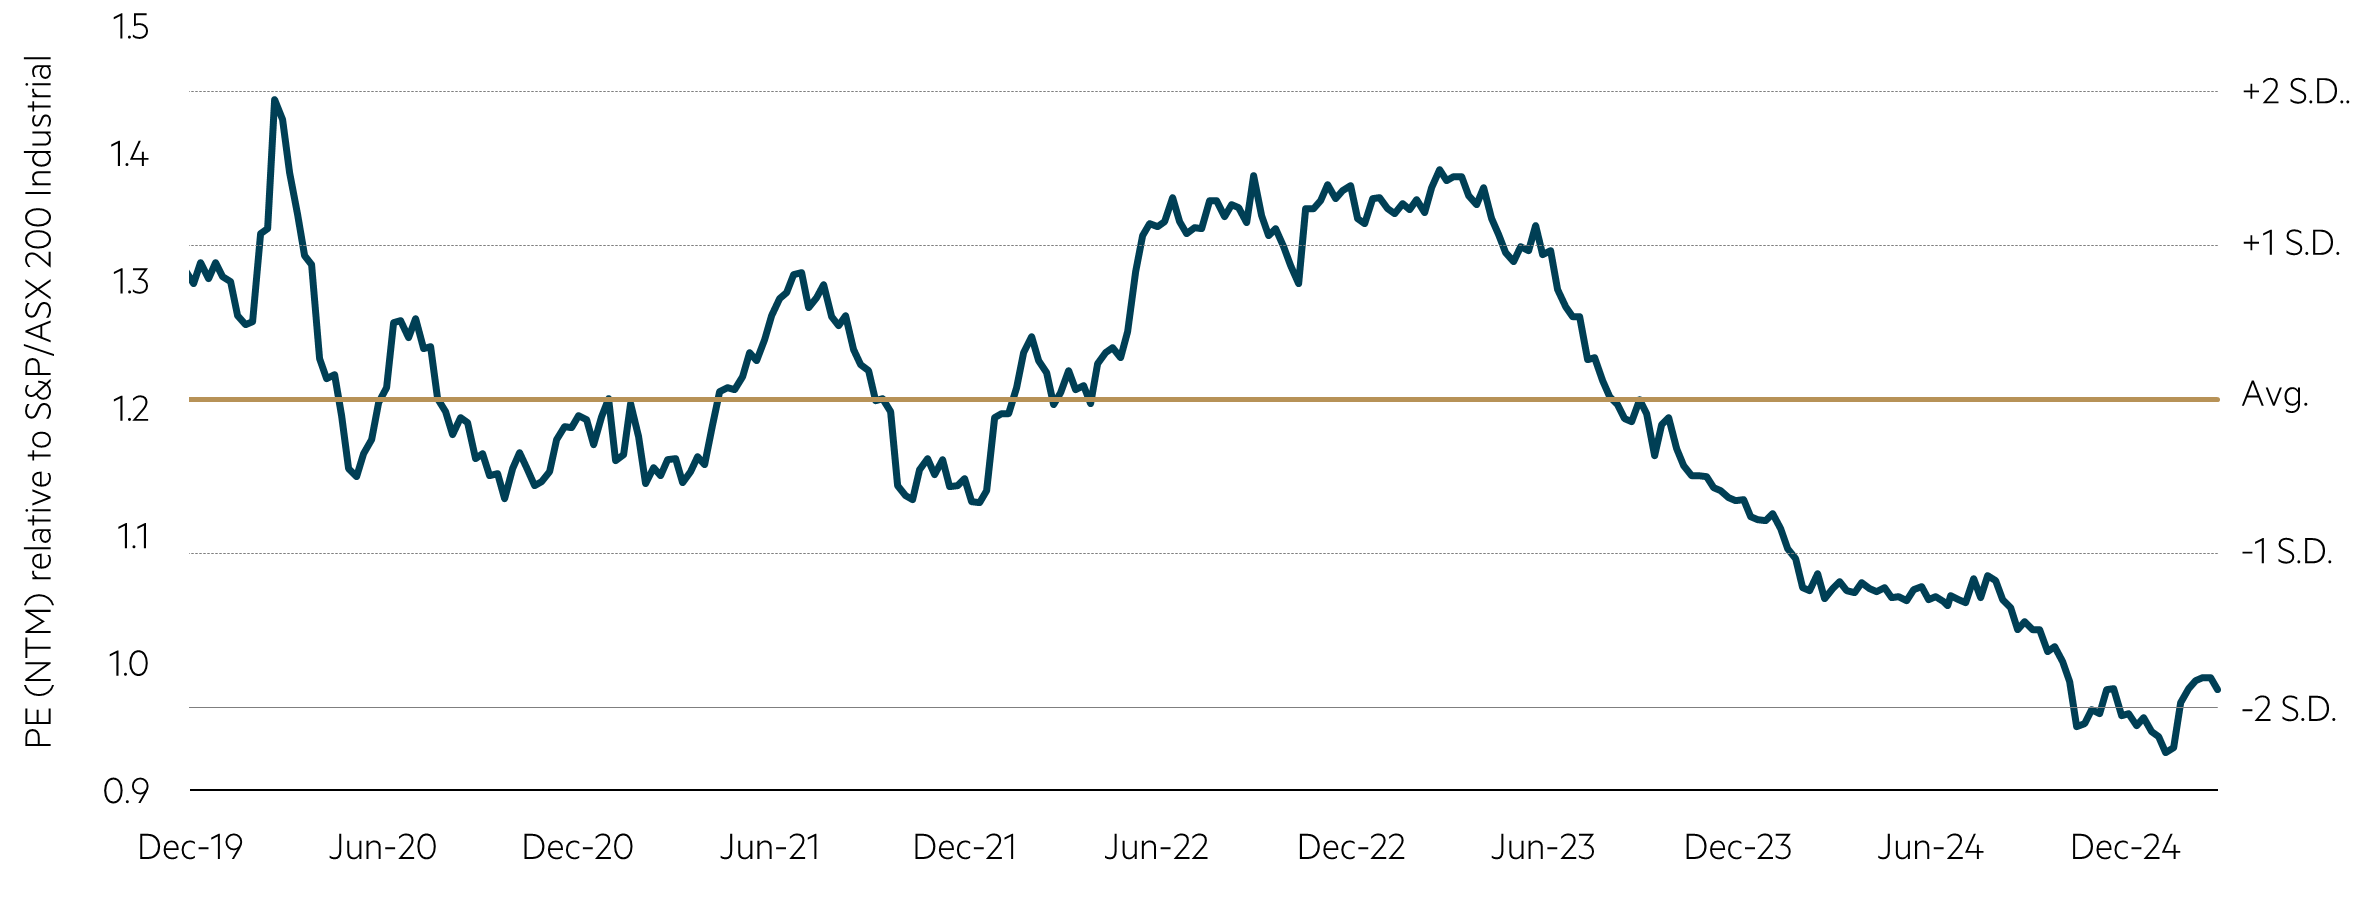
Source: FactSet, data to March 2025. Represents unweighted average next 12 month PE relative to S&P ASX200 Industrials Index of AMC, BXB, COL, CSL, RMD, TLS, TWE and WOW.
The Industrial benchmark incorporates the expensive valuations of key benchmark stocks such as Commonwealth Bank (CBA, 25 PE1), Goodman Group (24 PE), Macquarie Group (20 PE) and Wesfarmers (31 PE). These four stocks comprise ~25% of the benchmark. If we include National Australia Bank (15 PE) and Westpac (16 PE), this increases to ~35% of the benchmark (both these stocks are expensive relative to their history although less extreme). These premium valuations clarify why we have significant overweight positions in a number of the more attractively valued defensive stocks and the absence of most of the largest capitalization names in our portfolios.
The recent company reporting season was one of the most volatile in history with wild price swings accompanying many results. The fact that the beginning of the market correction overlapped with the heart of the reporting season was a significant contributing factor to volatility. However, it was also notable that in general the premium rated “crowded trades” underperformed relative to the discounted and less well-held stocks. This is after the former group had been strongly re-priced through 2024, often without much in the way of accompanying earnings upgrades necessary to justify the share price gains.
CBA was the only of the big four banks to report a full six-month result during February, reporting a solid result but with little growth in earnings. CBA remains a global outlier in terms of large bank valuations with a valuation of ~$250 bn and trading more than three times book value. There have been numerous contributing factors to the almost unprecedented revaluation of CBA over the last year or so, including international buying as investors deserted China in the second half of 2024 and diverted some of those funds to our larger liquid stocks. Domestically, super funds invested significant funds into the Australian market over recent years and this together with ongoing moves from active to passive management has seen the super fund holdings in the banks increase. Active managers have been sellers of banks and appear to have record underweights to the sector with their outperformance being a headwind to performance for most active managers. Renewed investor interest in China and US tech valuations coming under pressure is likely to see a broadening of investor appetite. We are of the view that the next 12 months will be far more challenging for the banks and given their extended valuations we are materially underweight the sector.
Super funds have been large buyers of banks
Active managers are significantly underweight the sector
Net purchases of banks sector (A$ bn; rolling annual)
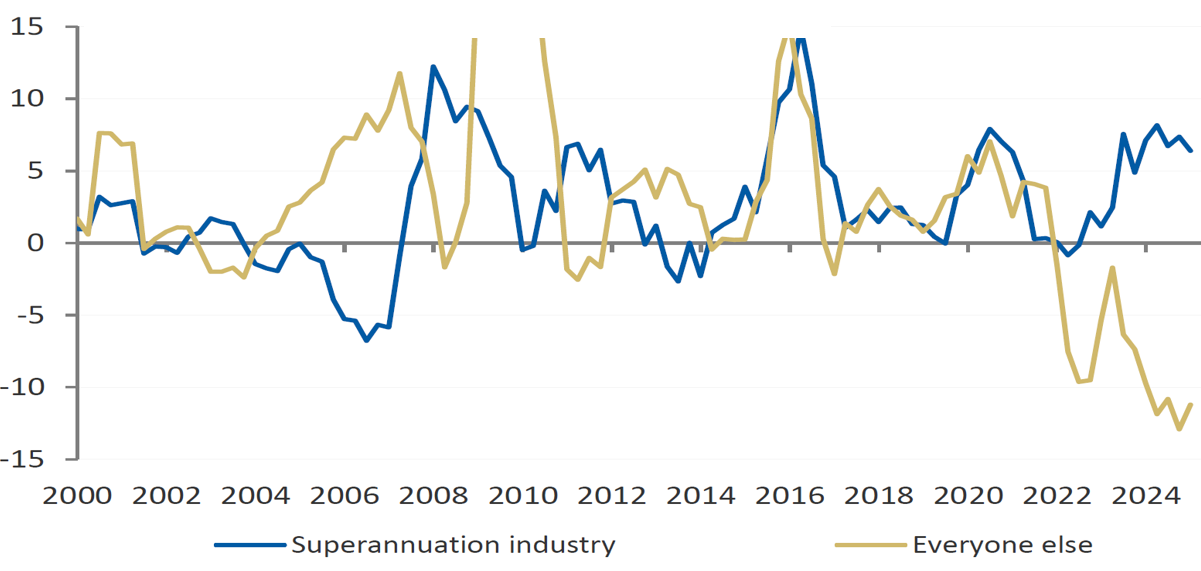
Source: ABS, Morgan Stanley Research. Data to December 2024.
The US market has suffered a set-back and much has been written about the end of the age of US “exceptionalism”. Many other markets held up well over the quarter but for reasons already discussed, our market has been a laggard. Market weakness has generally been good for value stocks, even if largely on a relative basis. We see no easy path for US tech stocks to recover their large falls and if this is the case, the broader US market is also likely to remain under pressure, which would impact our market negatively.
With the announcement of Trump’s tariffs on 2 April the downturn in the US market accelerated and contagion has spread globally. As is usual in such market moves, there has been considerable volatility with a move to defensive assets. Extreme valuation differentials have begun to narrow but have a long way to go to approach historical averages.
1 All PE data is FactSet FY1 consensus
Disclaimer
This document is prepared and issued by Maple-Brown Abbott Limited ABN 73 001 208 564, AFSL 237296 (“MBA”). This document contains general information only, and does not take into account your investment objectives, financial situation or specific needs. Before making any investment decision, you should seek independent investment, legal, tax, accounting or other professional advice as appropriate. Past performance is not a reliable indicator of future performance. Neither MBA, nor any of its related parties, directors or employees, make any representation or give any guarantee as to the return of capital, performance, any specific rate of return, or the taxation consequences of, any investment. Any views expressed on individual stocks or other investments, or any forecasts or estimates, are not a recommendation to buy, sell or hold, they are point in time views and may be based on certain assumptions and qualifications not set out in part or in full in this document. The views and opinions contained in this document are those of the authors as at the date of publication and are subject to change due to market and other conditions. Such views and opinions may not necessarily represent those expressed or reflected in other MBA communications, strategies or funds. Information derived from sources is believed to be accurate, however such information has not been independently verified and may be subject to assumptions and qualifications compiled by the relevant source and this document does not purport to provide a complete description of all or any such assumptions and qualifications. To the extent permitted by law, neither MBA, nor any of its related parties, directors or employees, make any representation or warranty as to the accuracy, completeness, reasonableness or reliability of this information, or accept liability or responsibility for any losses, whether direct, indirect or consequential, relating to, or arising from, the use or reliance on this information. Before making a decision whether to acquire, or to continue to hold an investment in the Fund, you should obtain and consider the current Product Disclosure Statement, Additional Information Booklet and Target Market Determination which is available at maple-brownabbott.com/document-library/ or by calling 1300 097 995. This information is current as at 31 March 2025 and is subject to change at any time without notice. ©2025 Maple-Brown Abbott Limited.

Garth
Interested in investing with us?
Investment Insights

The case for holding resources in an Australian small caps fund

The gold rush in the small caps market

Australian Equities March 2025 update