
Australian small caps is a volatile asset class and one for the long-term investor. With recent offshore bank failures and some concerns creeping into credit markets globally, balance sheets and cashflow come into focus, especially at the smaller end of the market where many companies still require funding for growth plans. While we don’t make macroeconomic calls and are by no means suggesting that there will be further issues to come, it is worthwhile exploring how Australian small cap companies are positioned if there is to be another banking crisis, by examining lessons from the Global Financial Crisis (GFC) in 2008.
Peak to trough
From November 2007 to March 2009, the US markets and the S&P/ASX 100 Index declined 50-55% as a downturn in the US housing market caused significant stress in an over-leveraged financial system, punctuated by the failures of Bear Stearns and Lehman Brothers in 2008. As shown on Chart 1 below, the Australian small caps market significantly underperformed over this period as the S&P/ASX Small Ordinaries Index declined 65%, with most of the underperformance coming through in the later stages of the downturn.
Chart 1. Performance on major indices through the Global Financial Crisis
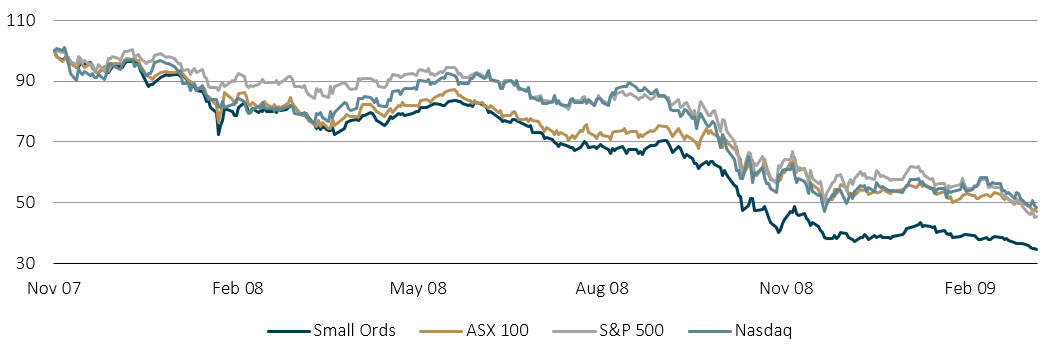
Source: Factset. 23 March 2023.
Two common traits drove the major underperformers in Australian small caps:
- Excessive debt: REITs in particular were over-geared heading into the GFC and almost all required deeply discounted equity raisings to survive. 25 REITs made up 11% of the S&P/ASX Small Ordinaries Index pre-GFC, and by March 2009, four were bankrupt and 19 experienced share price drawdowns greater than 90%. In our view, other over-geared sectors and example companies that struggled to overcome significant debt loads during this period include retailers (Pacific Brands), media companies (STW Communications), finance providers (City Pacific), industrials (Transpacific, Bradken), infrastructure owners (RiverCity) and forestry (Great Southern, Timbercorp).
- Funding needs: With capital markets largely closed to equity raisings, companies that required funding to complete projects such as a new mine, an oil exploration well or a clinical trial were effectively forced to stop operations and enter hibernation mode or look to secure expensive financing options.
The current downturn since the start of the 2022 calendar year has seen a significant underperformance of Australian small caps compared to large caps, with Australian small caps tracking more in line with US markets. The difficult environment was driven by the financial resolve of central banks around the world to contain elevated inflation levels by tightening financial conditions and increasing interest rates, which has disproportionately impacted perceived ‘higher risk’ asset classes like Australian small caps. On a relative basis, the Australian small cap market has experienced the worst period of underperformance since the GFC and materially underperforming the S&P/ASX 200 Index as risk sentiment took hold and significant valuation compression was experienced by smaller growth companies.
Chart 2. Performance of major indices 2022
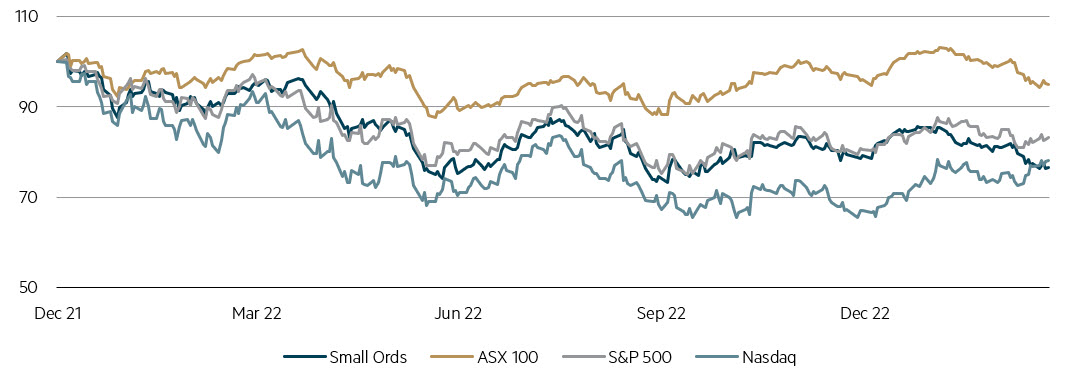
Source: Factset. 23 March 2023.
A different landscape
Compared to 15 years ago, there are several key differences across the Australian small caps landscape, which in our view should provide better insulation against further underperformance against other equity markets.
Index composition
There have been some favourable changes to the S&P/ASX Small Ordinaries Index constituents, notably fewer oil explorers and far less cyclical industrial companies. Many of these companies were among the bottom performers during the GFC as funding dried up and projects were put on hold. Following a wave of mergers and acquisitions in the utilities space over the past decade, there are no utility companies left in the index, with these companies typically carrying high debt levels. Finally at a sector level, there is a greater skew to consumer exposed companies today, however approximately half of this exposure is in more defensive retail categories, including gaming, travel, auto parts, childcare and funeral operators.
Table 1. Sector weights (%) November 2017 vs March 2023
| % Weight | Nov 07 | Mar 23 | Difference |
|---|---|---|---|
| Communications | 5.1 | 5.2 | 0.1 |
| Consumer | 6.9 | 16.5 | 9.6 |
| Staples | 1.9 | 4.3 | 2.4 |
| Energy | 10.2 | 5.6 | -4.6 |
| Financials | 6.7 | 9.1 | 2.4 |
| Health Care | 4.8 | 7.4 | 2.6 |
| Industrials | 17.8 | 8.4 | -9.4 |
| IT | 2.9 | 4.9 | 2.0 |
| Materials | 24.7 | 25.7 | 1.0 |
| Utilities | 8.1 | 0.0 | -8.1 |
| Real Estate | 10.9 | 12.9 | 1.9 |
Source: Factset. 23 March 2023.
Companies within the Real Estate sector, while facing cap rate expansion and falling valuations, are conservatively geared within a range of ~20-40%, providing some buffer against valuation headwinds. Heading into the GFC many companies in this sector had gearing of between 50-70%, providing little insulation to equity holders.
Balance sheet strength
The COVID period of 2020-2021 saw many companies raise a significant amount of equity to focus on strengthening balance sheets in the event of any pandemic driven issues. What occurred was far more accommodating to many companies, with strong demand leading to record profits, leaving a largely ungeared balance sheet. Conversely, the 2007 period saw many companies take on large levels of debt to battle perceived “lazy balance sheets”, leaving them un-prepared for a liquidity crunch.
Debt metrics are in far better shape for small cap companies today versus November 2007 as shown in Chart 3 below.
Chart 3. Indicators of balance sheet strength
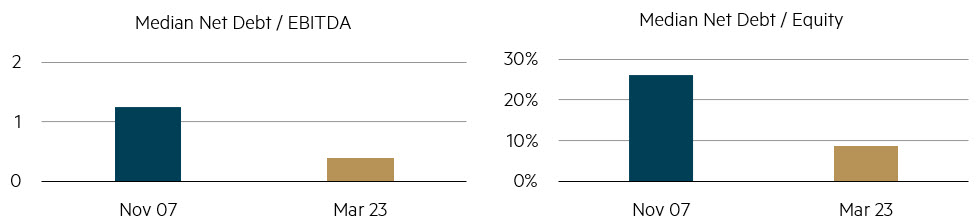
Source: Factset. 23 March 2023 .
Profitability and liquidity
In November 2007, 47 (or 24%) of stocks in the S&P/ASX Small Ordinaries Index were unprofitable, compared to just 27 (or 13%) today. The median cash holding of small cap companies today is $73m, compared to $36m pre-GFC. In our view, both of these factors should reduce the number of companies that would require a cash injection should trading conditions worsen.
Other factors to consider
We have focused purely on balance sheet and liquidity metrics in the above sections. However, when considering how stocks and an index will perform, earnings and valuation also need to be factored in. There is no denying that economic headwinds will lead to earnings downgrades across most industries, however the extent and pace of any potential decline is very hard to estimate in advance. Earnings estimates for the S&P/ASX Small Ordinaries Index declined approximately 25% over the GFC period. Valuation is at similar levels today to November 2007 – at around 16.5x P/E based on 12 months forward earnings.
We believe that the changing nature of small cap stocks in the benchmark, stronger balance sheets and liquidity profiles should provide some downside protection for companies and investors in this type of scenario.
Leading the charge on the recovery
Despite the underperformance leading into the GFC, the Australian small caps market led the recovery over the subsequent two years, substantially outperforming the S&P/ASX 100 Index over this period – leverage can work both ways and investors looking to time the market on the way out may have missed a significant part of this rally.
Chart 4. Performance of major indices post GFC recovery
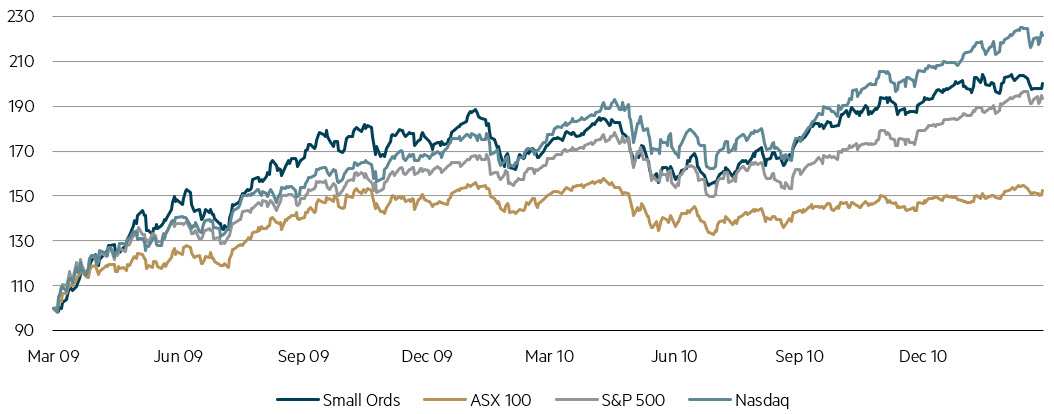
Source: Factset. 23 March 2023.
The Australian small caps market has already experienced a material multiple de-rate recently and while we see earnings being challenged in the near future, Australian small cap market valuations now look attractive relative to other equity classes, notably the Australian large cap market.
Disclaimer
This information was prepared and issued by Maple-Brown Abbott Ltd ABN 73 001 208 564, Australian Financial Service Licence No. 237296 (“MBA”). This information must not be reproduced or transmitted in any form without the prior written consent of MBA. This information does not constitute investment advice or an investment recommendation of any kind and should not be relied upon as such. This information is general information only and it does not have regard to any person’s investment objectives, financial situation or needs. Before making any investment decision, you should seek independent investment, legal, tax, accounting or other professional advice as appropriate. This information does not constitute an offer or solicitation by anyone in any jurisdiction. This information is not an advertisement and is not directed at any person in any jurisdiction where the publication or availability of the information is prohibited or restricted by law. Past performance is not a reliable indicator of future performance. Any comments about investments are not a recommendation to buy, sell or hold. Any views expressed on individual stocks or other investments, or any forecasts or estimates, are point in time views and may be based on certain assumptions and qualifications not set out in part or in full in this information. The views and opinions contained herein are those of the authors as at the date of publication and are subject to change due to market and other conditions. Such views and opinions may not necessarily represent those expressed or reflected in other MBA communications, strategies or funds. Information derived from sources is believed to be accurate, however such information has not been independently verified and may be subject to assumptions and qualifications compiled by the relevant source and this information does not purport to provide a complete description of all or any such assumptions and qualifications. To the extent permitted by law, neither MBA, nor any of its related parties, directors or employees, make any representation or warranty as to the accuracy, completeness, reasonableness or reliability of the information contained herein, or accept liability or responsibility for any losses, whether direct, indirect or consequential, relating to, or arising from, the use or reliance on any part of this information. Neither MBA, nor any of its related parties, directors or employees, make any representation or give any guarantee as to the return of capital, performance, any specific rate of return, or the taxation consequences of, any investment. This information is current at 4 April 2023 and is subject to change at any time without notice. © 2023 Maple-Brown Abbott Limited.

Matt Griffin joined Maple-Brown Abbott in April 2022 as Co-Portfolio Manager for Australian Small Companies, bringing 14 years’ investment experience in Australian small cap equity portfolio management and fundamental stock research. In his current role, he is responsible for leading the Australian small companies equity business, focusing on medium-term earnings delivery combined with a differentiated market-leading sustainability framework which is designed to outperform in most market environments.
Before joining Maple-Brown Abbott, Matt worked as Co-Portfolio Manager on the AMP Capital Australian Emerging Companies strategy for four years. Prior to that, he was Investment Director at IFM Investors, where he was integral to the launch of the IFM Australia small caps and micro caps strategy, and a small companies analyst at Macquarie Asset Management.
Matt
Interested in investing with us?
Investment Insights

The case for holding resources in an Australian small caps fund

The gold rush in the small caps market

Australian Equities March 2025 update