
Australian small cap resource stocks are often viewed as more speculative relative to their industrial counterparts. While historical returns generated by Australian small resources have been more volatile, periods of ‘super-normal’ returns have been demonstrated, resulting from outperformance in select commodity cycles.
The ability to consistently pick commodity cycles is inherently difficult and not a focus of our investment process. However, we believe there is significant alpha-generating potential at a stock specific level, although investors need to be selective at the smaller end of the Australian small resources market.
Small resources sector allocation and underlying commodity exposures have varied over different periods
The Resources sector allocation within the Australian small caps market, as measured by the S&P/ASX Small Ordinaries Index, has varied significantly over time. Over the past 20 years, the Resources sector allocation peaked at approximately 45% in 2010, coinciding with the Chinese commodity super cycle, and bottomed at approximately 12% weight in 2015. The current weighting is approximately 29% (as of end-March 2025), which is broadly at the mid-point of recent history. The quality of resources companies included in the S&P/ASX Small Ordinaries Index has improved over time with a shift away from exploration companies to more producers currently.
Looking at underlying commodity exposures, the dispersion has been volatile. This includes the focus on steel and metal related commodities fuelling China’s infrastructure boom over the 2005-2010 period, the metals focus supporting the electric vehicle/lithium boom over the 2021-2022 period, and the gold bull market over the 2024-2025 period to date.
Resources allocation by weight of the S&P/ASX Small Ordinaries Index and underlying commodity exposures over time
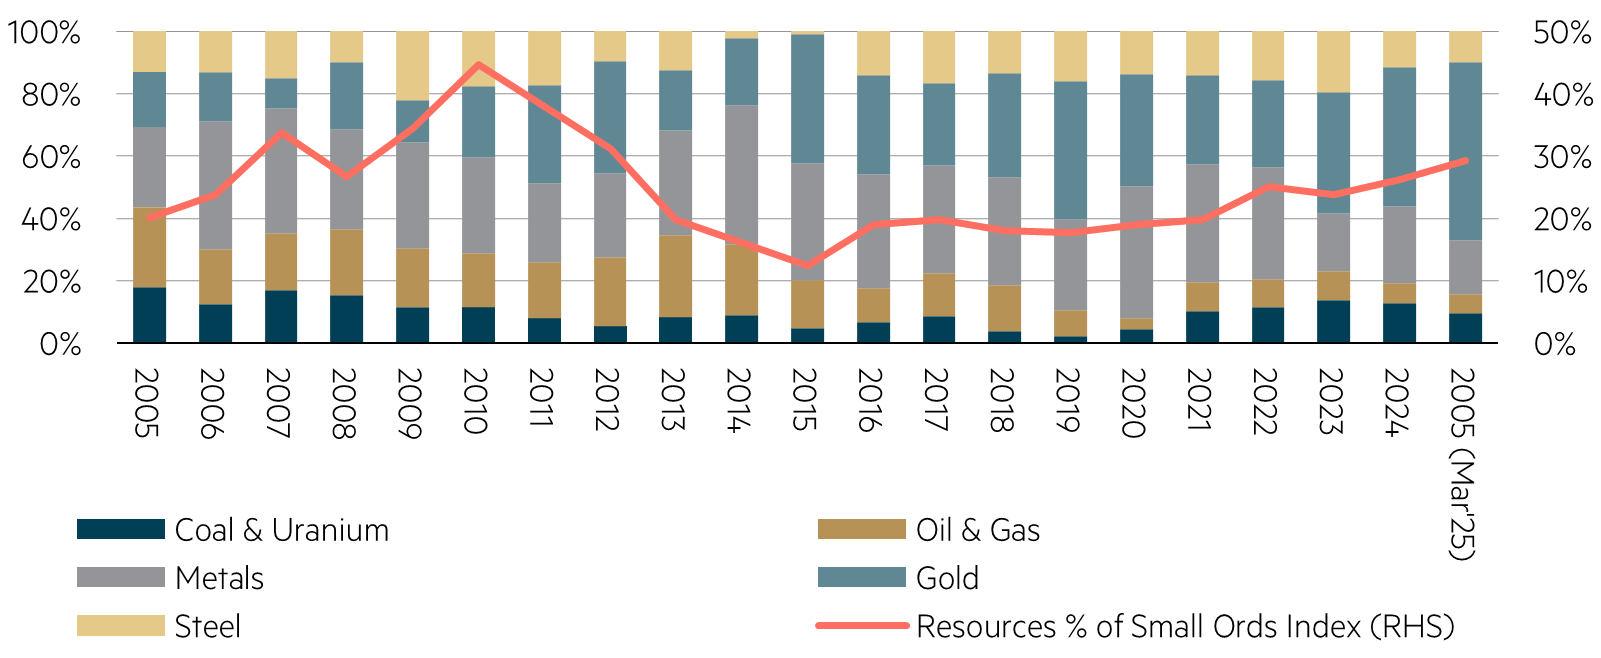
Source: Maple-Brown Abbott, FactSet, calendar year data between 2005 – 2024 and March 2025, S&P/ASX Small Ordinaries Index.
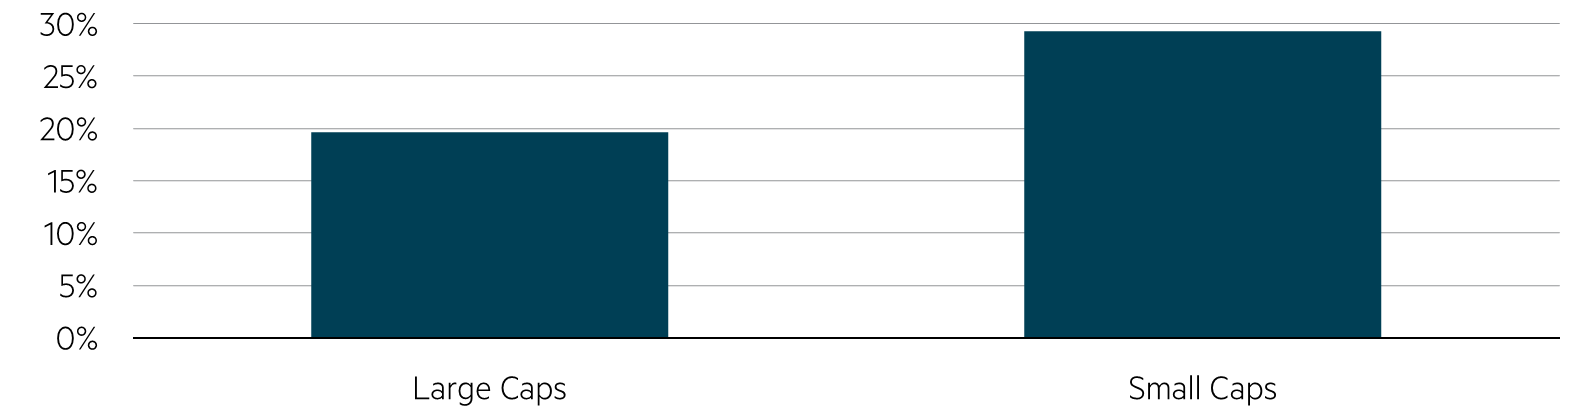
As compared to Australian large caps, the smaller end of the market currently has a higher index weight percentage allocation to the Resources sector. Large cap resource stocks are dominated by bulk commodities — most notably iron ore, and to a lesser extent, coal. Demand for these commodities is typically driven by global economic conditions, particularly Chinese economic growth, and stimulus measures, which can be difficult for investors to predict. In contrast, smaller resource companies offer greater diversity in terms of commodities, geographic exposure, and stages of the project cycle. Small resources also tend to have more exposure to high-growth, emerging themes such as the electric vehicle revolution, the energy transition, increased demand for battery and industrial metals and growing interest in uranium.
Resources sector weight for the large cap and small cap indices
Underlying commodity exposures across the large cap and small cap resource indices
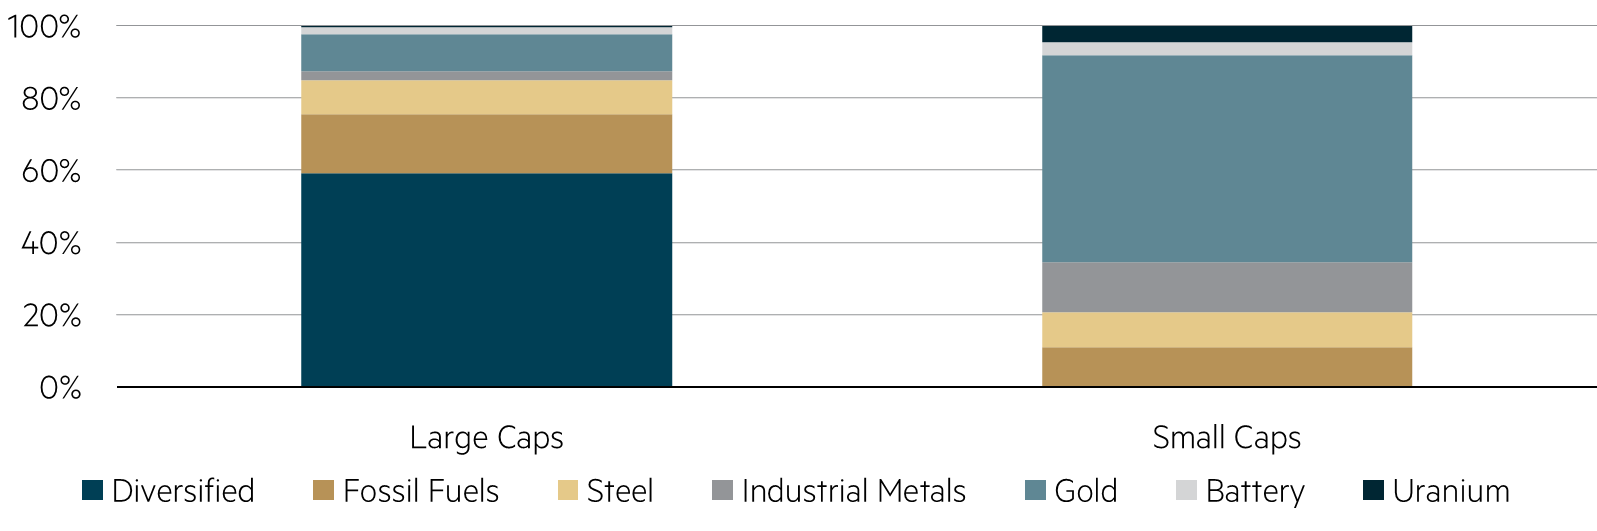
Source: Maple-Brown Abbott, FactSet, 31 March 2025, ‘Large Caps’ and ‘Small Caps’ refers to S&P/ASX 100 Index and S&P/ASX Small Ordinaries Index, respectively.
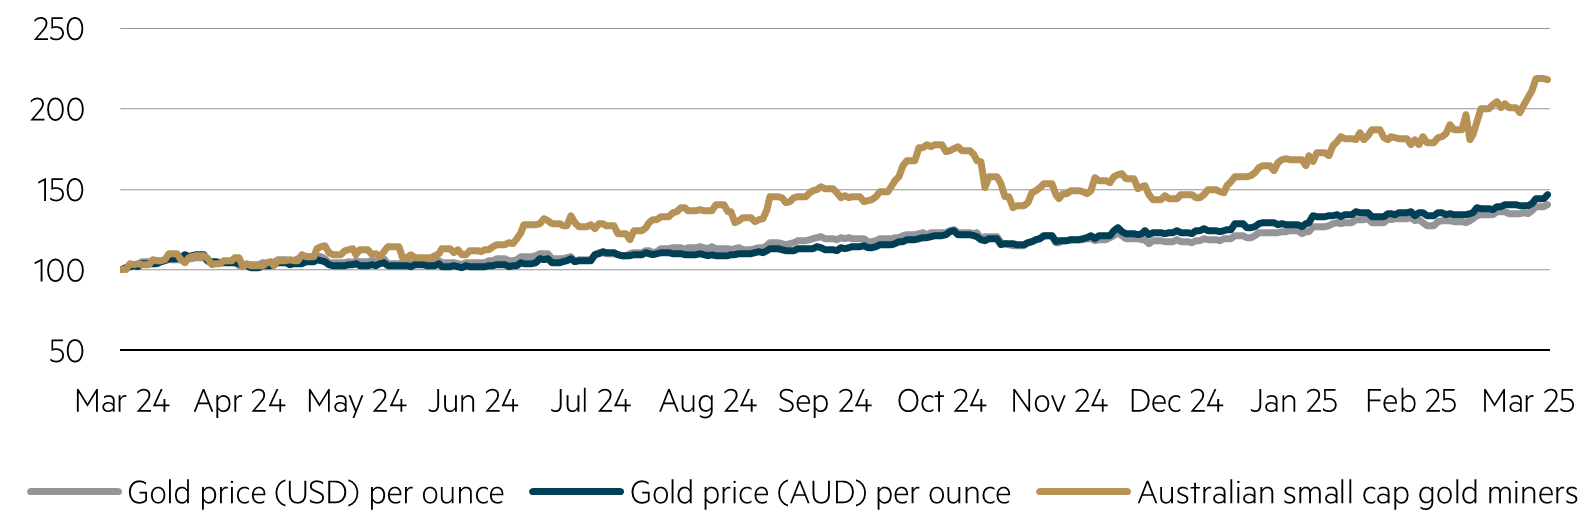
In addition, Australian small-cap managers that allocate to resources have been major beneficiaries of the recent surge in the gold price, which has boosted the performance of Australian small-cap gold miners. This is due to the substantial leverage associated with commodity prices, coupled with easing cost pressures and robust free cash flow generation. As at the end of March 2025, the gold miners represent approximately 17% of the S&P/ASX Small Ordinaries Index.
Gold price vs. Australian small cap miners (starting index = 100)
Gold sector weight in S&P/ASX Small Ordinaries Index
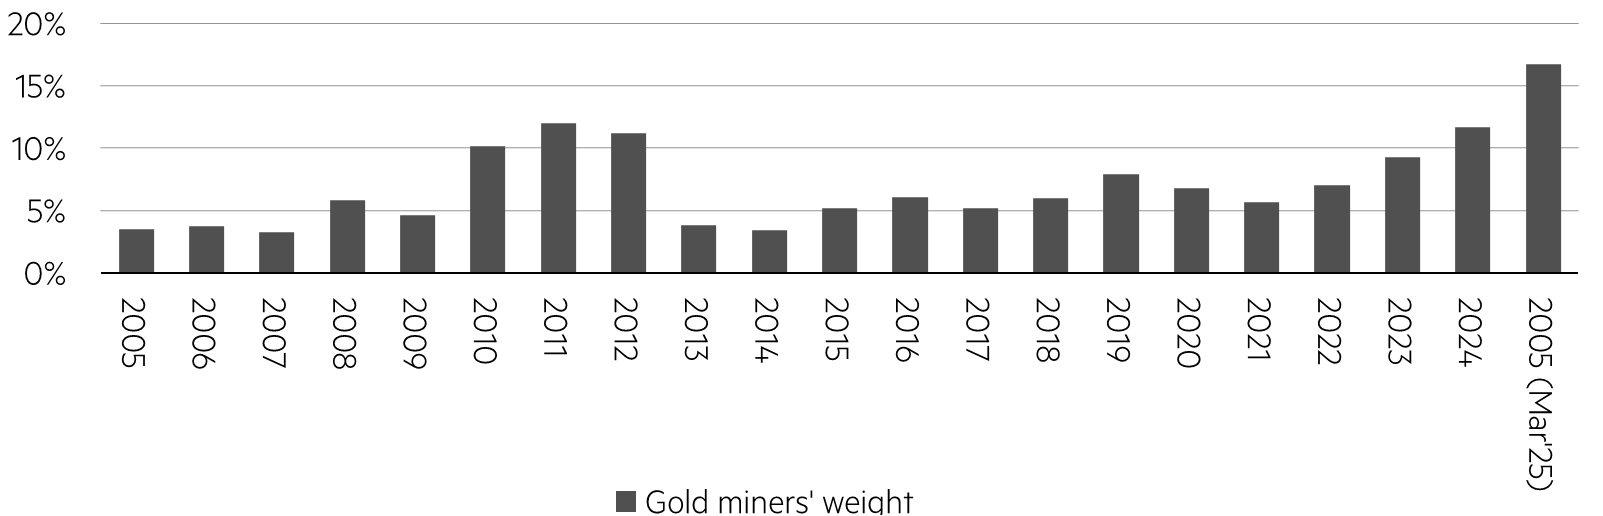
Source: Maple-Brown Abbott, FactSet, S&P/ASX Small Ordinaries Index, 2005 – 2024 and 31 March 2025.
Small resources’ out-performance typically comes with select commodity cycles
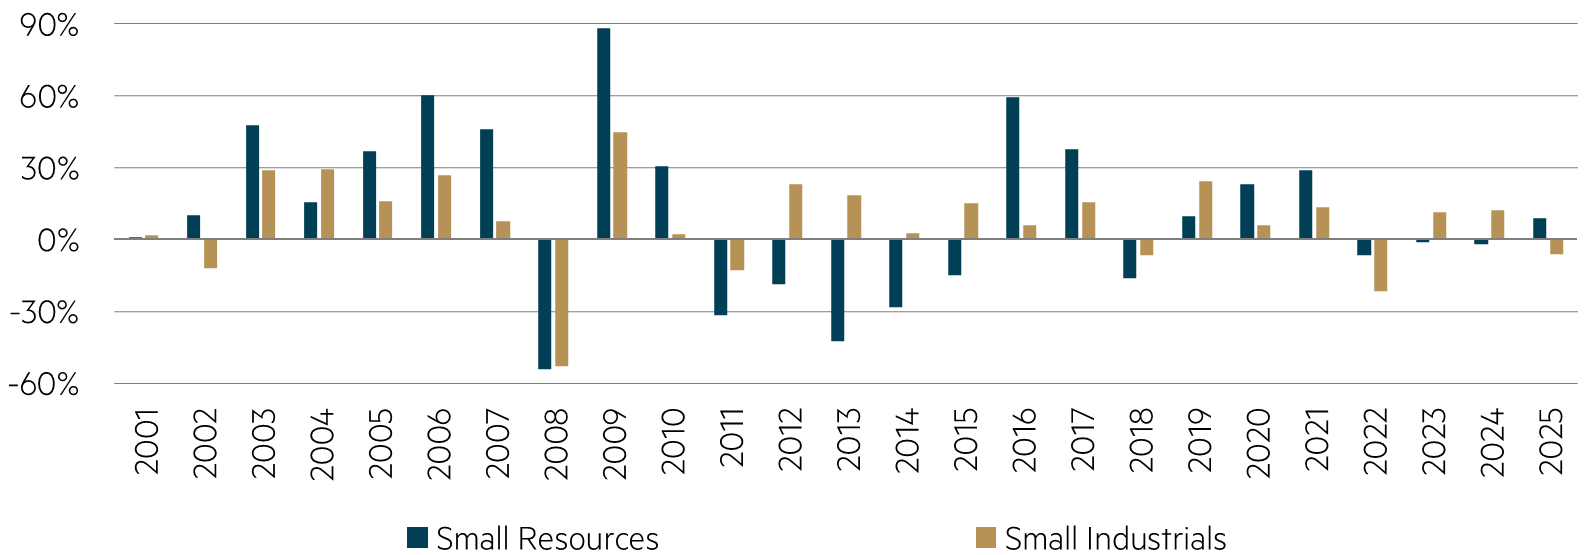
The returns generated by Australian small resources vary widely on a calendar year basis. However, surprisingly, Australian small resources have outperformed Australian small industrials in 54% of calendar years and on a cumulative basis over the past 25 years.
There have been periods of ‘super-normal’ returns for small resources, driven by commodity outperformance from select commodity cycles. Performance mean reversion is typically observed between these select commodity cycles. Notable commodity cycles include the Chinese Industrial Commodities Super-Cycle (2005–2010, ex-GFC period), Electric Vehicle/Lithium Boom (2021–2022) and Gold Bull Market (2024–2025 year-to-date).
Calendar year returns for Australian small resources and industrials (% p.a.)
Cumulative performance for Australian small resources and industrials
(starting index at 100 since 2000)
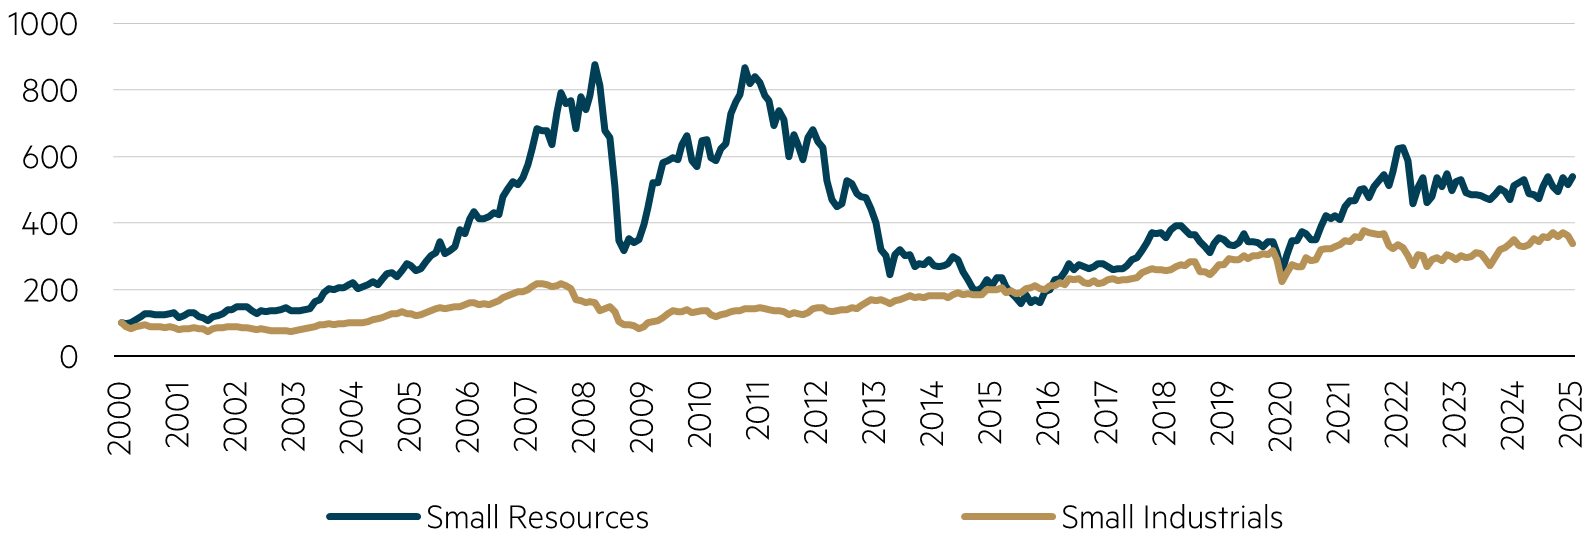
Source: Maple-Brown Abbott, FactSet, calendar year data between January 2001 – March 2025, Small Resources = S&P/ASX Small Resources (Total Return) Index and Small Industrials = S&P/ASX Small Resources (Total Return) Index.
Going forward, small resources offer higher earnings growth expectations relative to Australian large resources – this is driven by the higher gold and lower bulk commodity exposures.
Earnings per share (EPS) growth for Australian Small Resources and Australian All Resources
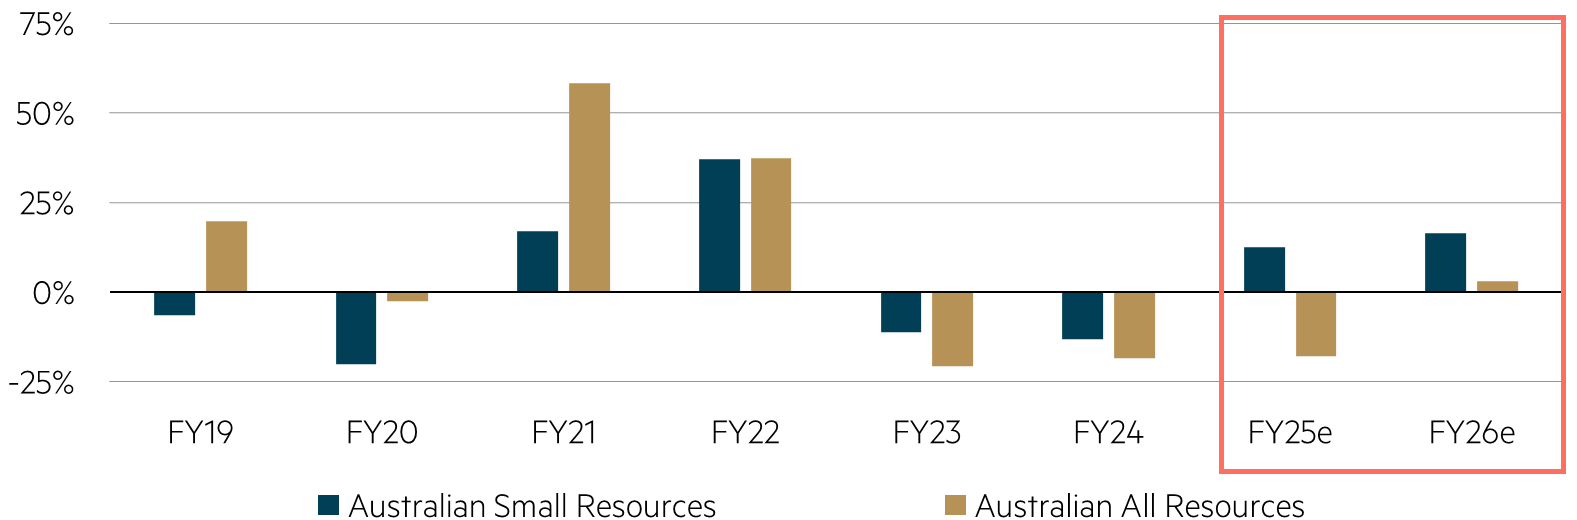
Source: Maple-Brown Abbott, Macquarie Equity Research, 1 April 2025.
Australian small-cap managers’ resource positioning and outperformance patterns
Many Australian small-cap managers invest in industrial-only companies despite typically being benchmarked against the S&P/ASX Small Ordinaries Index. Since 2017, the rolling 3-year performance of S&P/ASX Small Industrials Index relative to the benchmark has been mostly benign although has experienced material dispersion over the 2007-2011 and 2013-2016 periods. Since 2000, holding a passive small industrials portfolio had a tracking error of 5.7% p.a. relative to the S&P/ASX Small Ordinaries (Total Return) Index.
Rolling 3-year performance difference between small industrials and the small cap benchmark performance

Source: Maple-Brown Abbott, FactSet, monthly data between March 2000 – March 2025, Small Industrials = S&P/ASX Small Industrials (Total Return) Index and Small Ordinaries = S&P/ASX Small Ordinaries (Total Return) Index.
This structural Resources sector underweight by the Australian small cap manager universe is clear given the historical median alpha generation being negatively correlated with Australian small resources relative performance (correlation -0.7). This increases the risk of industrial-only Australian small-cap managers generating alpha during extended periods where resources outperform industrials.
Rolling 3-year median Australian small-cap manager active return and Australian small resources outperformance
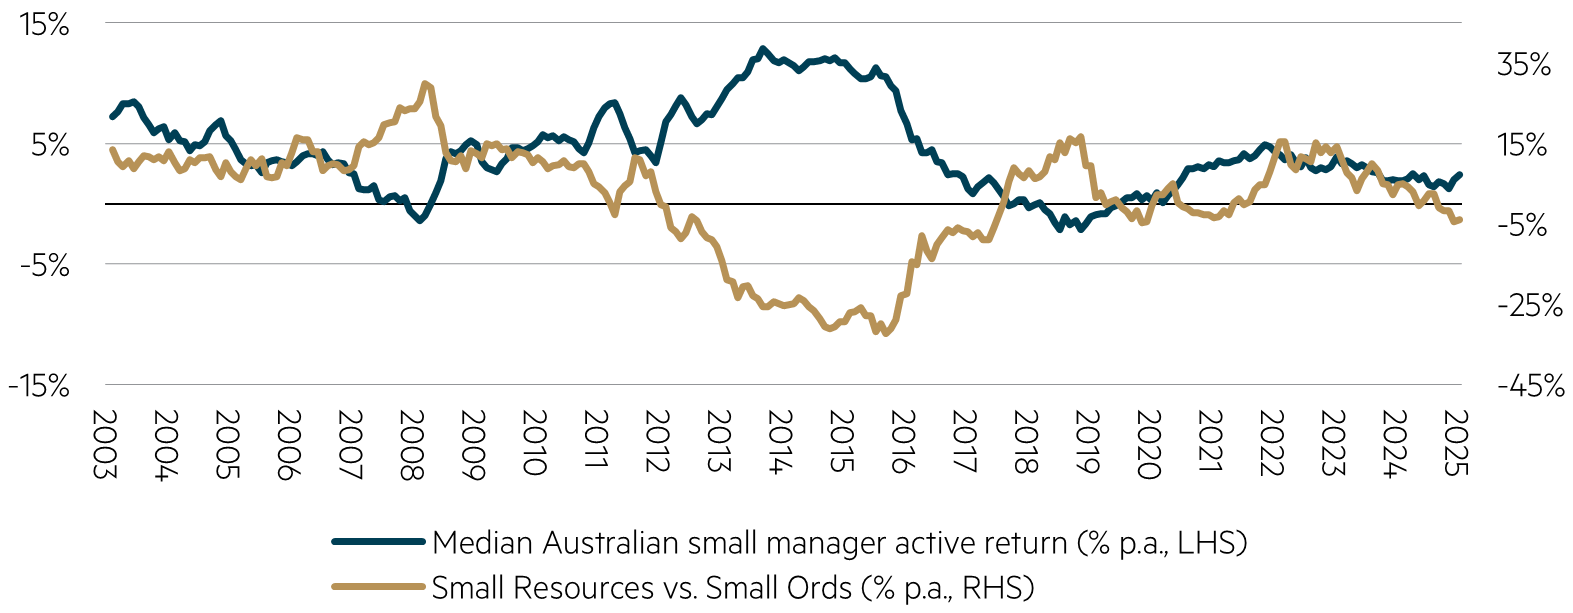
Source: MBA, FactSet, monthly data between May 2000 – March 2025, Morningstar Australian small cap manager universe, S&P/ASX Small Resources (Total Return) Index vs. S&P/ASX Small Ordinaries (Total Return) Index.
In addition, the number of constituents in the small cap resources sector is growing given increasing dual stock listings and the strong Initial Public Offering (IPO) pipeline. On the other hand, several small industrial companies have been taken over and/or delisted with minimal IPO activity to replenish stock numbers. This increases the risk of a shrinking opportunity set for industrial-only Australian small cap managers.
Resources stock considerations for the Maple-Brown Abbott Australian small caps strategy
We define ourselves by our ‘earnings drive share prices’ investment philosophy with a company’s share price performance driven by medium-term earnings delivery and the sustainability of the earnings delivery being an important driver of long-term performance. In addition, we are driven by discovering undervalued Australian small companies with idiosyncratic exposures.
We believe these opportunities can be exploited across the entire Australian small companies’ universe, including both industrial and resource exposed companies, which is a key differentiator relative to many of our peers.
We do not make commodity calls (we use consensus forecasts for commodity pricing in our stock models, and run various scenarios using spot price and downside price assumptions to assess the robustness of a company’s balance sheet) rather focusing on idiosyncratic exposures at the stock level, which we believe is the most reliable source of alpha generation at the smaller end of the market. Exposure to both industrials and resources is expected to result in a smoothening of the strategy’s alpha generation potential over time relative to the S&P/ASX Small Ordinaries Index and peers.
Given the inherent risks of resource companies, we are highly selective with a key focus on producing companies (or those companies close to production) with strong management teams that have a track record of meeting/exceeding expectations. Our process screens out exploration companies in addition to those companies in the development phase that are not expected to be in production within our investment horizon of 2-3 years. This results in the strategy having a structural underweight to the Resources sector.
Given the highly selective process, the strategy has generated significant outperformance in the Resources sector since inception.
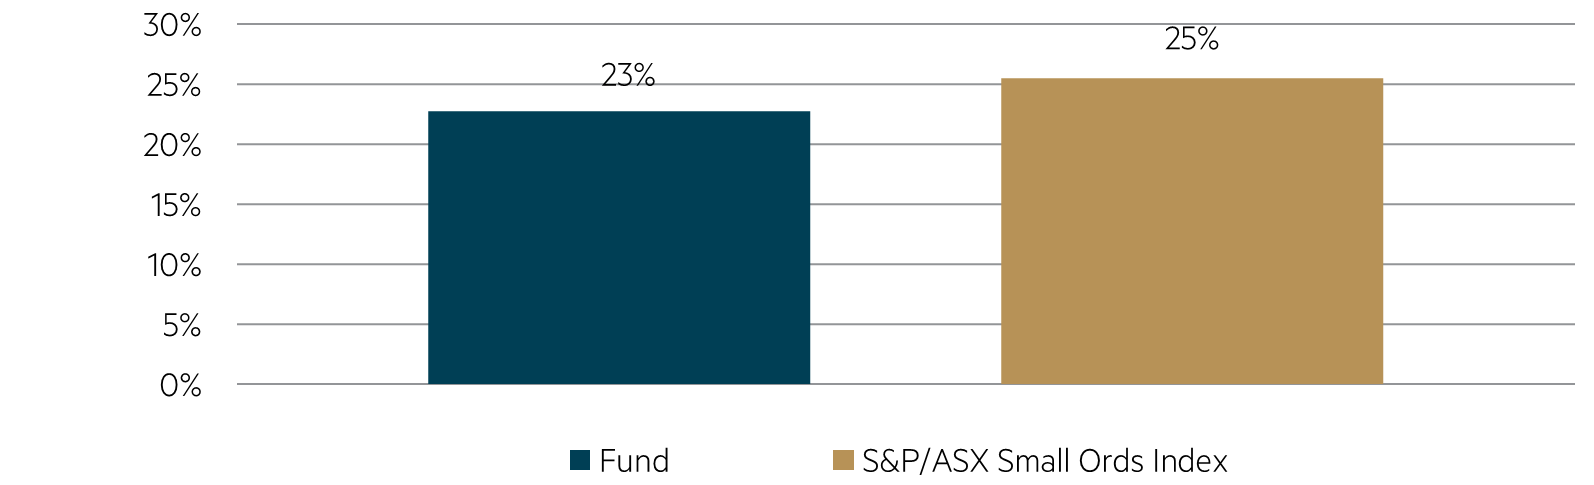
Average 23% absolute fund weighting and 2% underweight vs. benchmark to small resources since inception ….
… generating 10% of total absolute return and 44% of alpha since inception
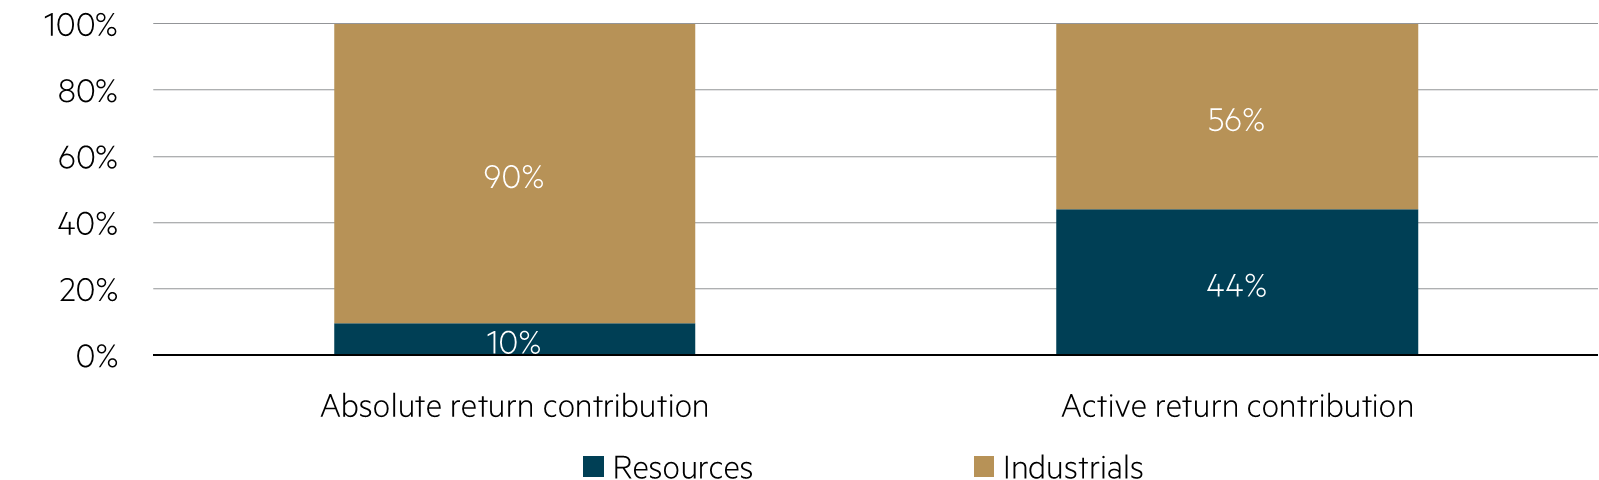
Source: MBA, FactSet, estimated, represents a composite of the AMP Capital Australian Small Caps Composite between February 2013 – March 2022 and the MBA Australian Small Companies Fund between June 2022 – March 2025, performance estimate only. The performance of the Composite does not necessarily reflect how the MBA Australian Small Companies Fund would have historically performed over the same period. Past performance is not a reliable indicator of future performance.
Summary
In summary, we believe investors should not shy away from the heightened volatility of Australian small resources but rather embrace the significant alpha generating potential. However, investors need to be selective and look to employ active Australian small cap managers that have a strong track record of outperformance in the resources sector.
Disclaimer
This article is prepared and issued by Maple-Brown Abbott Limited ABN 73 001 208 564, AFSL 237296 (‘MBA’) as the Responsible Entity of the MBA Australian Small Companies Fund (ARSN 658 552 688) (‘Fund’). This article contains general information only, and does not take into account your investment objectives, financial situation or specific needs. Before making any investment decision, you should seek independent financial advice. This document does not constitute an offer or solicitation by anyone in any jurisdiction. Past performance is not a reliable indicator of future performance. Neither MBA, nor any of its related parties, directors or employees, make any representation or give any guarantee as to the return of capital, performance, any specific rate of return, or the taxation consequences of, any investment. Any views expressed on individual stocks or other investments, or any forecasts or estimates, are not a recommendation to buy, sell or hold, they are point in time views and may be based on certain assumptions and qualifications not set out in part or in full in this document. These individual stocks referred to may or may not be currently held by the Fund. Information derived from sources is believed to be accurate, however such information has not been independently verified and may be subject to assumptions and qualifications not described in this document. To the extent permitted by law, neither MBA, nor any of its related parties, directors or employees, make any representation or warranty as to the accuracy, completeness, reasonableness or reliability of this information, or accept liability or responsibility for any losses, whether direct, indirect or consequential, relating to, or arising from, the use or reliance on this information. Before making a decision whether to acquire, or to continue to hold an investment in the Fund, investors should obtain and consider the current PDS and Target Market Determination (TMD) or any other relevant disclosure document. For the Fund, the PDS, AIB and TMD are available at maple-brownabbott.com/document-library or by calling 1300 097 995. This information is current as of 28 April 2025 and is subject to change at any time without notice. © 2025 Maple-Brown Abbott Limited.

Phillip Hudak joined Maple-Brown Abbott in April 2022 as Co-Portfolio Manager for Australian Small Companies, bringing over 20 years’ investment experience, with 15 years dedicated to Australian small cap equity portfolio management and fundamental stock research. In his current role, Phillip is responsible for leading the Australian small companies equity business, focusing on medium-term earnings delivery combined with a differentiated market-leading sustainability framework which is designed to outperform in most market environments.
Before joining Maple-Brown Abbott, Phillip worked as Co-Portfolio Manager on the AMP Capital Australian Emerging Companies strategy for nine years. Prior to that, he was a small companies analyst at ING Investment Management, analyst at MIR Investment Management and an investment consultant with Russell Investment Group.
Phillip
Interested in investing with us?
Investment Insights

The case for holding resources in an Australian small caps fund
The gold rush in the small caps market

Australian Equities March 2025 update